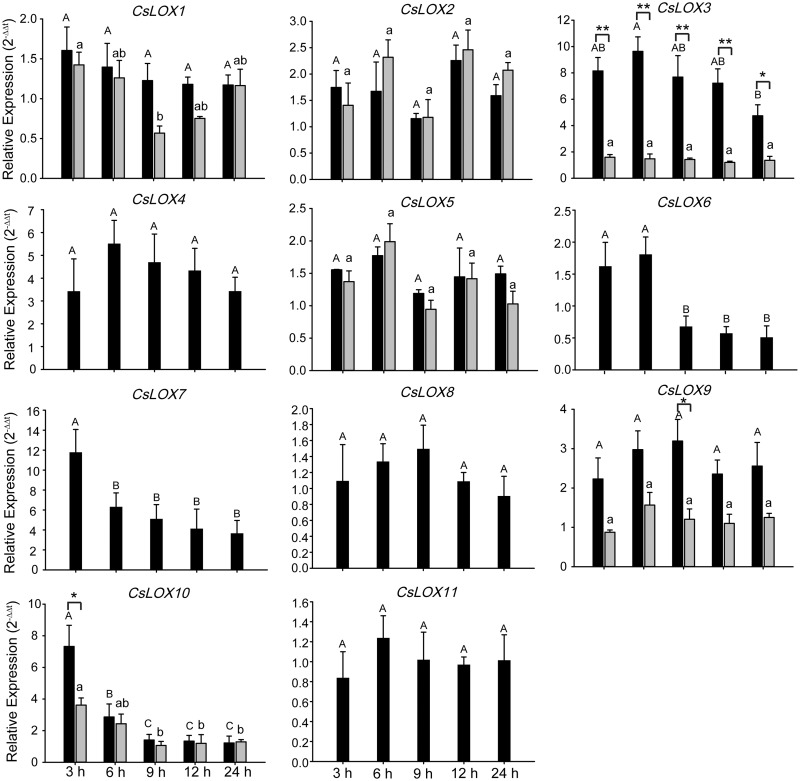
Fig. 9.
Expression patterns of CsLOX genes under MeJA phytohormone treatments. qRT–PCR analysis of CsLOX genes at different time points. Black and gray bars represent the full-length and alternatively spliced transcripts, respectively. Bars indicate the means � SD (n = 3) of three biological replicates. Different letters above the bars denote significant differences at P < 0.05. The asterisks indicate the significant level (*P < 0.05, **P < 0.01) based on a Tukey’s honestly significant difference test.

