Figure 1.
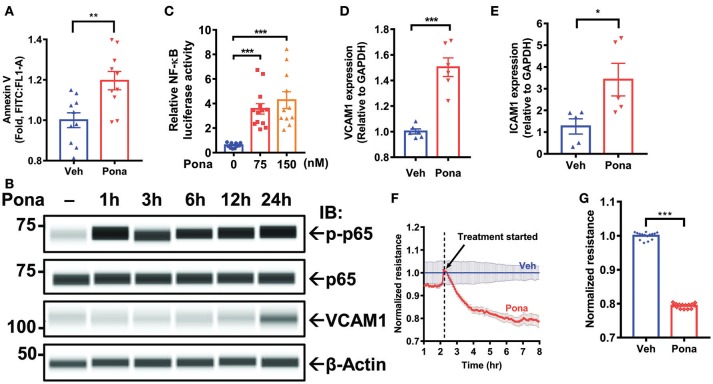
Ponatinib mediates endothelial inflammatory responses (A) Flow cytometric analysis of Annexin V staining in HAECs treated with ponatinib (150 nM, 24 h). Graph shows the fold increase of apoptosis in ponatinib treated cells compared to control cells. Data is sourced from two independent experiments, each contains 4–5 technical replicates. Error bars represent mean ± SEM. Statistical significance was assessed using student's t-test (two-tailed). **p < 0.01. (B) Expression of phospho-p65, total p65, VCAM1, and β-actin (loading control) in HAECs treated with ponatinib was assessed by Protein simple WES system (capillary electrophoresis western analysis). Protein bands are shown as pseudoblots. (C) Graph demonstrates relative NF-kB activity, as measured by promoter-driven luciferase reporter gene assay in HAECs treated with phamacological concentrations of ponatinib for 24 h, and presented as ratio of firefly/renilla luciferase activity. A representative data set of three independent experiments is shown, contains 11–13 technical replicates. Error bars represent mean ± SEM. Statistical significance was assessed using ANOVA followed by Bonferroni post hoc testing for multiple group comparison. ***p < 0.001. (D-E) qRT-PCR analysis of relative vcam1 and icam1 expression in HAECs treated with ponatinib (150 nM, 24 h). A representative data set of three independent experiments is shown, contains 5–6 technical replicates. Error bars represent mean ± SEM. Statistical significance was assessed using student's t-test (two-tailed). ***P < 0.001; *P < 0.05 vs. vehicle control (Veh) (F) Ponatinib (150 nM) effect on transcellular electrical resistance was assessed using ECIS system as described in methods. The dashed line indicates addition of ponatinib. Graph shows normalized resistance measured approximately every 4 min for 8 h, contains 4 technical replicates. Error bars represent mean ± SEM. (G) Graph demonstrates normalized resistance after 7 h of ponatinib treatment relative to Veh, contains 15 technical replicates. Error bars represent mean ± SEM. Statistical significance was assessed using student's t-test (two-tailed). ***P < 0.001.

