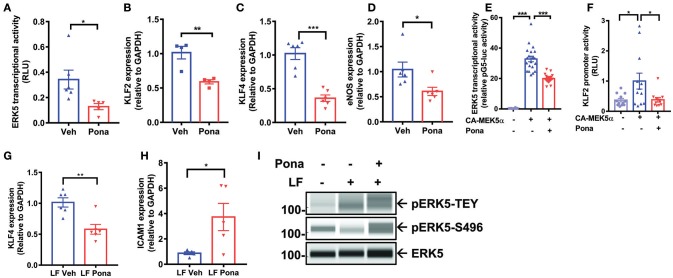
Figure 2.
Ponatinib inhibits ERK5 transcriptional activity (A) Graph demonstrates relative ERK5 transcriptional activity, as measured by mammalian one-hybrid assay, in HAECs treated with ponatinib (150 nM, 24 h), and presented as ratio of firefly/renilla luciferase activity. A representative data set of three independent experiments is shown, contains 6 technical replicates. Error bars represent mean ± SEM. Statistical significance was assessed using student's t-test (two-tailed). *P < 0.05 vs. Veh control. (B-D) qRT-PCR analysis of relative klf2, klf4, and enos expression in HAECs treated with ponatinib (150 nM, 24 h). A representative data set is shown, contains 4–6 technical replicates. Error bars represent mean ± SEM. Statistical significance was assessed using student's t-test (two-tailed). ***P < 0.001; **P < 0.01; *P < 0.05 vs. Veh control. (E) Graph demonstrate relative ERK5 transcriptional activity, as measured by mammalian one-hybrid assay in HAECs treated with ponatinib (150 nM, 24 h). Results are presented as ratio of firefly/renilla luciferase activity. As indicated, some cells were also transfected with CA-MEK5α. A representative data set of three independent experiments is shown, contains 11–20 technical replicates. Error bars represent mean ± SEM. Statistical significant was assessed using ANOVA followed by Bonferroni post hoc testing for multiple group comparison. ***P < 0.001 vs. Veh control. (F) Graph demonstrates relative KLF2 promoter activity, as measured by promoter-driven luciferase reporter gene assay in HAECs treated with ponatinib (150 nM, 24 h), and presented as ratio of firefly/renilla luciferase activity. As indicated, some cells were also transfected with CA-MEK5α. Error bars represent mean ± SEM. Data set contains 10–12 technical replicates. Statistical significance was assessed using student's t-test (two-tailed). *P < 0.05 vs. Veh control. (G-H) qRT-PCR analysis of relative klf4 and icam1 expression in HAECs treated with ponatinib (150 nM, 24 h) in the presence of laminar flow. Data set contains 5–6 technical replicates. Error bars represent mean ± SEM. Statistical significance was assessed using student's t-test (two-tailed). *P < 0.05; **P < 0.01; vs. Veh control. (I) Expression of phospho-ERK5 at T218/Y220 (TEY), S496, and total ERK5 in HAECs treated with ponatinib (150 nM, 30 min) was assessed by Protein simple WES system (capillary electrophoresis western analysis). Protein bands are shown as pseudoblots.

