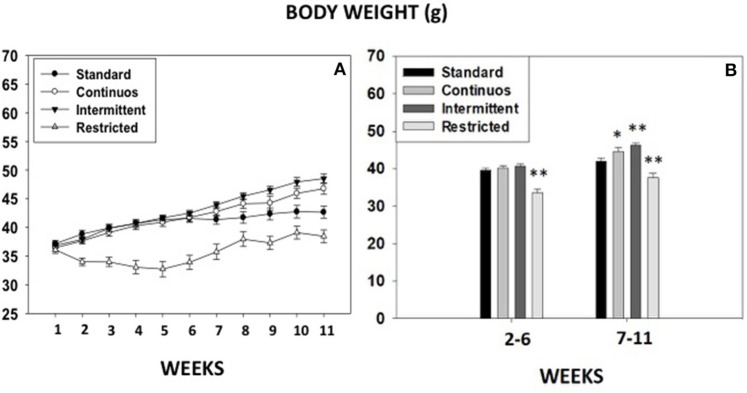
Figure 7.
Body weight progression across different groups of mice exposed to different food access conditions. (A) Body weight (gr) gain from week 1 till week 11, and (B) average body weight of the four groups during two periods of 5 weeks each. Mean (±S.E.M.) weight in grams. *p < 0.05; **p < 0.01 significantly different from standard group.

