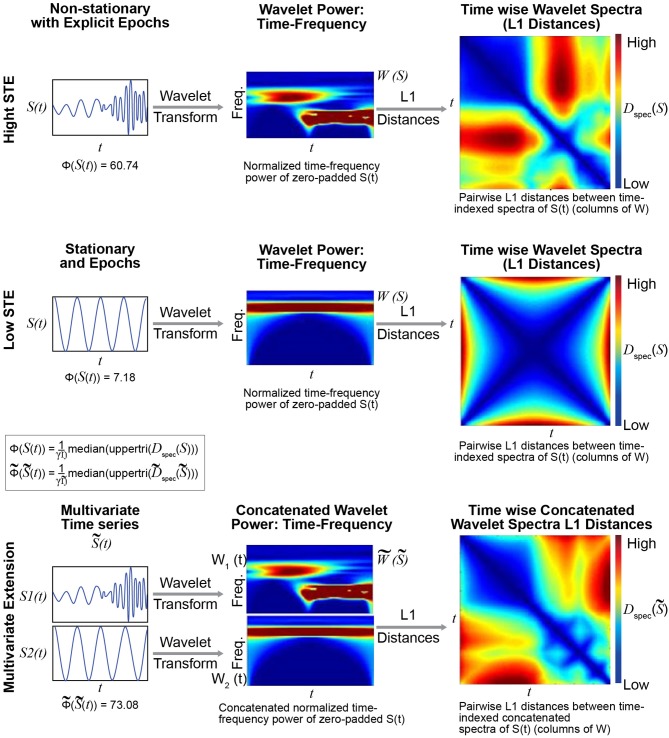
Figure 4.
The metric Φ is intended to capture spectral non-stationarities, or spectrally distinguishable temporal epochs (SDTEs), in univariate (Top) and multivariate (Bottom) timeseries. The univariate version uses wavelets to capture temporally-localized spectral information, yielding a set of time-indexed spectra (Top middle), which we normalize to have total power equal to the product of the number of frequencies and the number of timepoints. The spectrum at each timepoint carries modest edge effects, which are more pronounced near the signal boundaries and for slower frequencies captured by wavelets that do not taper as much near the boundaries. We then compute pairwise L1 distances between the time-indexed spectra (Top right) and compute the median off-diagonal value of the resulting T × T matrix (scaled by a scaling factor γ; see Technical Supplement for details). The multivariate extension of Φ concatenates the time-frequency spectra of all univariate constituents along the frequency dimension (Bottom middle), leaving the time dimension unaltered. In this case, we compute the median off-diagonal elements of the T × T matrix of pairwise differences between time-indexed concatenated spectra (Bottom right). The multivariate metric is higher when constituent univariate time-frequency spectra exhibit their largest within-signal spectral differences in mutually distinct temporal intervals. The case shown here does not illustrate the role of differential intervals of SDTEs among constituent timeseries. The multivariate extension of this metric was successful in capturing slight changes in frequencies in several consecutive short term epochs too (Supplementary Figure 1). Finally, in all cases, the results were highly similar for both L1 (Manhattan) and L2 (Euclidean) distances (multivariate Φ outperformed multivariate kurtosis for both distance measures).

