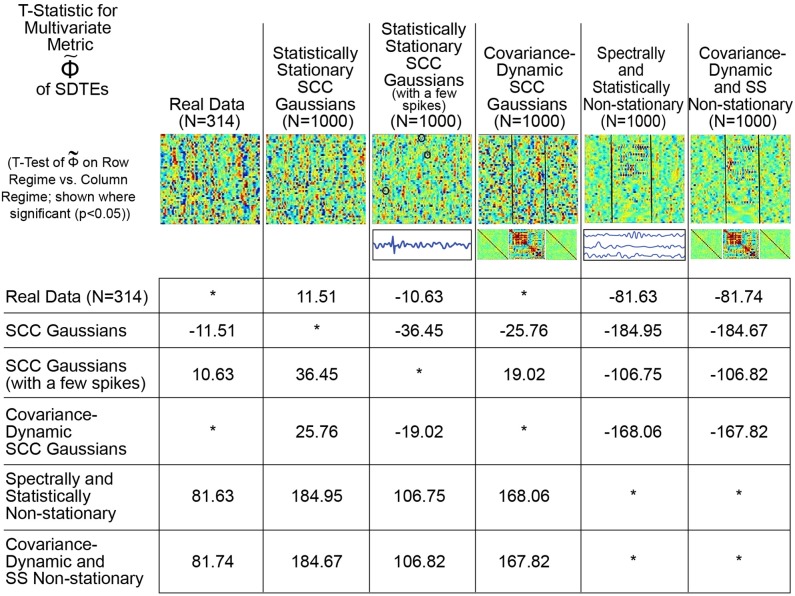
Figure 9.
This table presents the t-statistic (where significant at the p < 0.05 level, asterisks where non-significant), for pairwise T-tests of on the row regime vs. the column regime. From this standpoint, we see that the real network timecourses (row 1) exhibit significantly greater presence of SDTEs than the SCC Gaussians (column 2) modeled on them, significantly less evidence of SDTEs than the lightly contaminated “noisy” SCC Gaussians (column 3) and the explicitly SS Non-stationary Regimes (columns 5 and 6) and are statistically indistinguishable from the explicitly covariance-dynamic SCC Gaussians (column 4). Unlike what was found using multivariate kurtosis, the covariance-static SCC Gaussians (row 2) are in terms of significantly less dynamic than the covariance-dynamic SCC Gaussians (column 4) and both SS Non-stationary regimes (columns 5 and 6). Again, in contrast to multivariate kurtosis, the lightly contaminated SCC Gaussians (row 3) in terms of are significantly less dynamic than both SS Non-stationary regimes (columns 5 and 6). is putting regimes exhibiting different kinds of temporally epochal behavior—including the epochal behavior seen in statistically stationary Gaussian processes—in what seems a plausible ordering with respect to dynamism: SCC Gaussians ≼ Real Data ≈ Covariance-Dynamic SCC Gaussians ≼ Noise-Contaminated SCC Gaussians ≼ SS Non-stationary ≼ Covariance-Dynamic SS Non-stationary (where curly binary relations indicate ordinal evidence of potentially relevant multivariate epochal behavior as measured by ).

