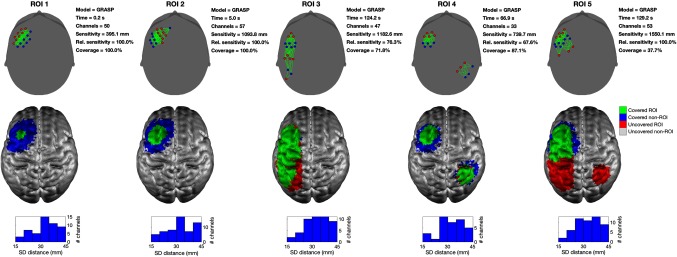
Fig. 10.
Solutions produced by Array Designer. This example shows the arrays obtained by solving the array design problem with the GRASP algorithm for all five ROIs and and . In the upper row, sources are shown as red circles, detectors as blue circles, and channels in green. For each array, the time taken, the number of viable channels, the absolute sensitivity of the array over the ROI, the relative sensitivity of the array over the ROI, and the relative coverage of the array are reported. The middle row displays the results on the GM surface. The area of the ROI covered by each array is shown in green, while any portion of an ROI that remains uncovered is shown in red. Brain areas that are covered but are outside of the ROI are shown in blue. The bottom row provides a histogram of the source–detector distances present within each array. Note that the GRASP algorithm promotes the spreading of the array solution over the ROI and is able to cover noncontiguous regions (as compared to Fig. 6). It is not able to cover ROI 5, likely because there are simply too few optodes.

