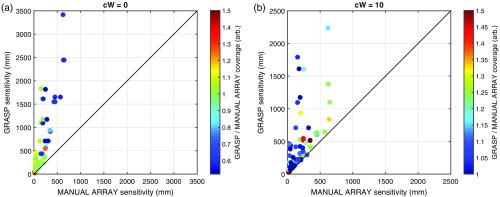
Fig. 5.
Comparison between manual single-distance arrays and Array Designer solutions with (a) and (b) . The total array sensitivity of each solution achieved by the Array Designer approach (on the axis) is plotted against that achieved by the manual single-distance array approach for 75 simulations. Each dot (representing one simulation) is color-coded based on the ratio of the coverage of the solution achieved by Array Designer to that obtained by the manual single-distance array. Note that the sensitivity achieved by Array Designer is always higher than that achieved by the manual single-distance arrays. For , both the sensitivity and the coverage achieved by Array Designer are always higher than that achieved by the manual single-distance arrays.

