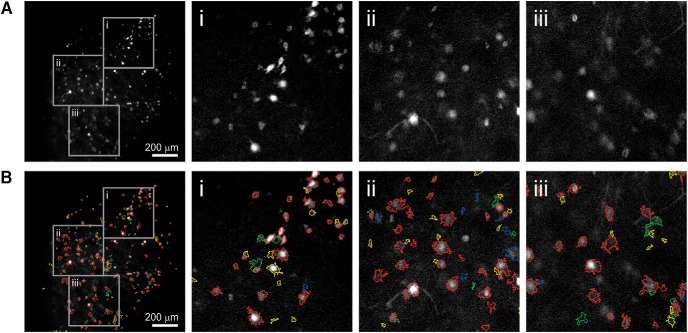
Figure 4.
Striatum dataset and ROIs identified by ACSAT. A, The time-collapsed image of striatum dataset and zoom-in images (Ai, Aii, and Aiii, corresponding to the gray boxes). B, ACSAT-determined ROIs from multiple iterations overlying on the time-collapsed image (red, yellow, green, and blue outline corresponds to iteration 1, 2, 3, and 4, respectively). The second (yellow), third (green), and fourth (blue) iterations are shown for comparison although ACSAT terminated at iteration 1 (red).

