
Figure 6.
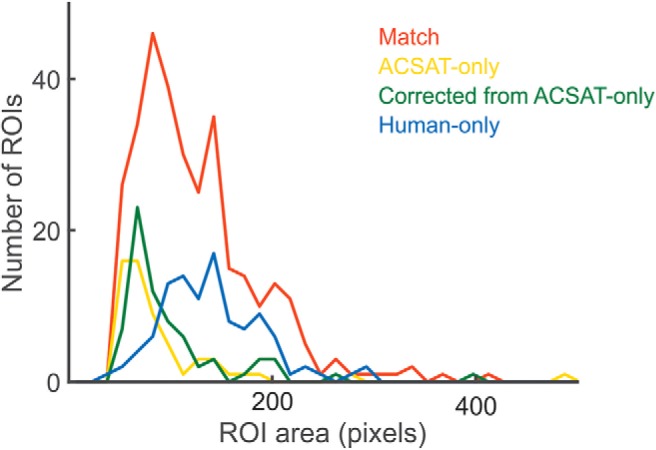
Distribution of ROI size for hippocampus dataset A. ROIs identified by ACSAT and human (red) with various size. The ACSAT-only ROIs (yellow) and those missed by human experts (green) tend to have small areas, while the areas of human-only ROIs (blue) appear slightly larger.