
Figure 7.
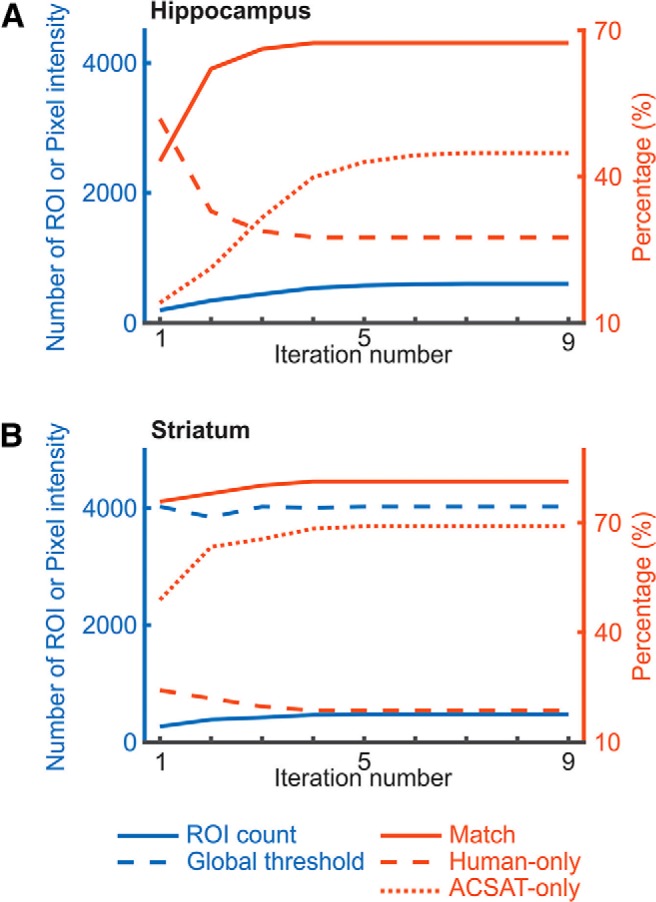
Performance of ACSAT over iterations. A, B, For both hippocampus dataset A (A) and striatum dataset (B), the cumulative number of identified ROIs (solid line) increased steadily over iterations. The global threshold (dashed blue line) tended to decrease with each iteration, allowing ACSAT to capture ROIs with lower intensity. Both recall (solid red line) and false discovery rate = 1 – precision (dotted red line) increased with iterations, while the false-negative rate (dashed red line) decreased. All results reported here are based on human-generated ROIs before secondary manual inspection of false positives.