
Figure 8.
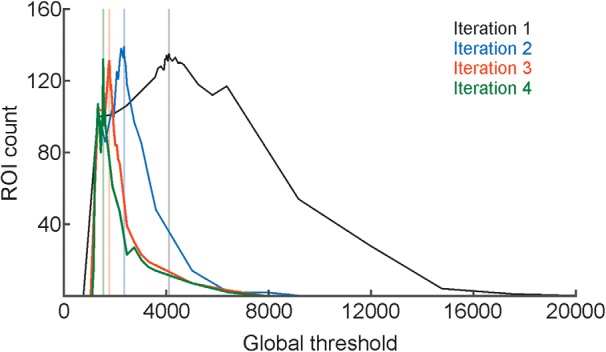
Convergence of the FIBAT optimal global threshold value for the hippocampus dataset A. FIBAT first sampled at a coarse scale across a wide intensity range, and then focused on a small potential intensity range with a fine scale to identify the optimal global threshold value that generated most ROIs. The vertical lines indicate the final optimal global threshold value determined by FIBAT for each iteration.