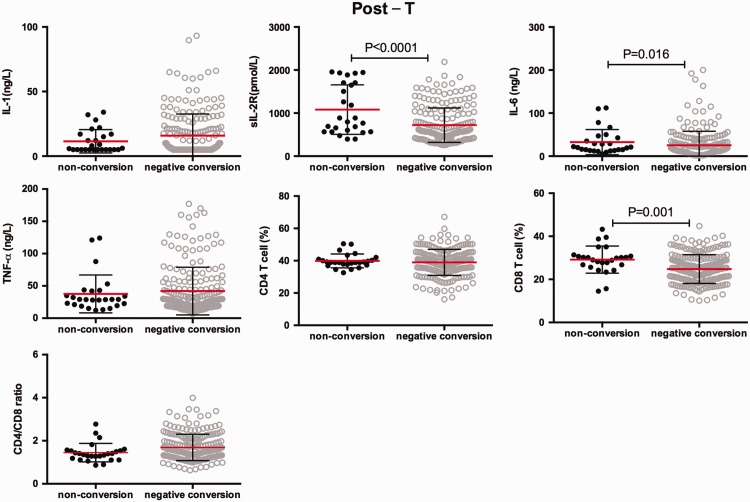
Figure 6.
Plots showing serum levels of interleukin-1β, soluble interleukin-2 receptor, interleukin-6, and tumour necrosis factor-α, the peripheral blood percentage of CD4+ T cells and CD8+T cells, and the CD4+/CD8+ ratio in individuals with pulmonary tuberculosis in the non-conversion and conversion groups at post-treatment. Horizontal lines indicate mean with SD.

