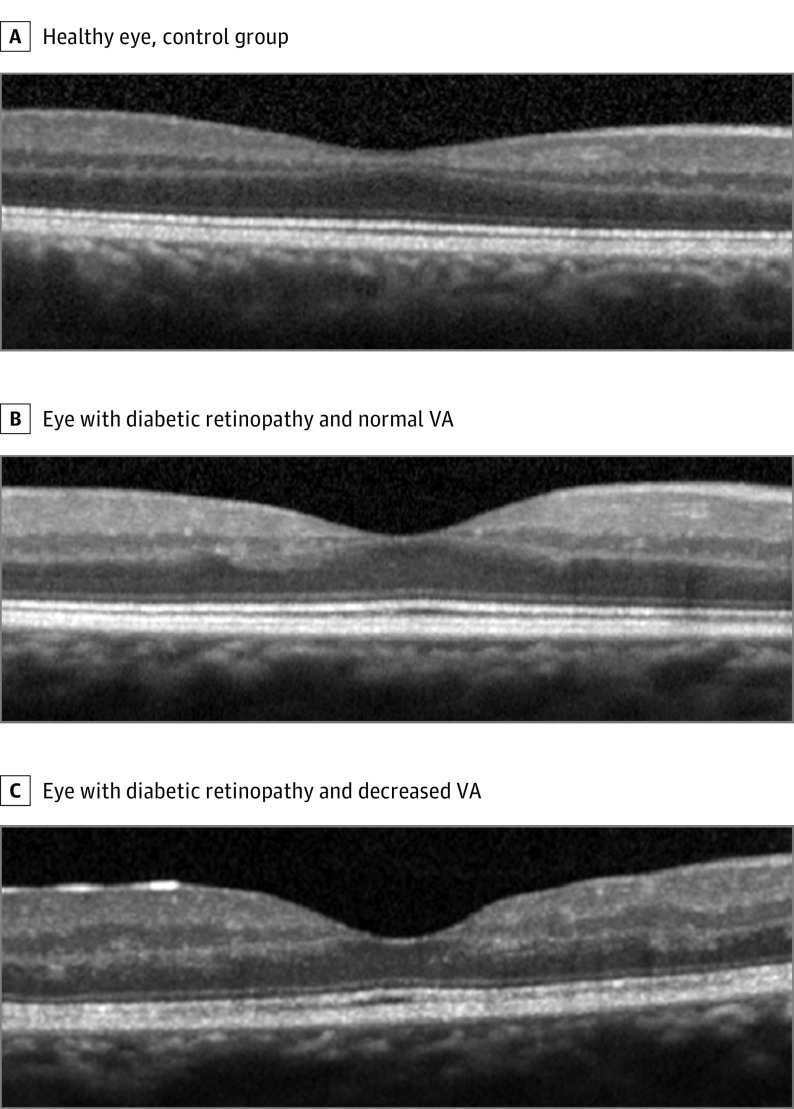
Figure 4. Optical Coherence Tomography in the Eyes of the Control Group and Patients With Diabetes.
Normal visual acuity (VA) represents 0 logMAR (Snellen equivalent, 20/20); decreased VA for the eye depicted represents 0.3 logMAR (Snellen equivalent, 20/40). Irregularities of the inner retinal layers are visible in all eyes with diabetic retinopathy; the stage is more advanced in the patient with the worst VA.

