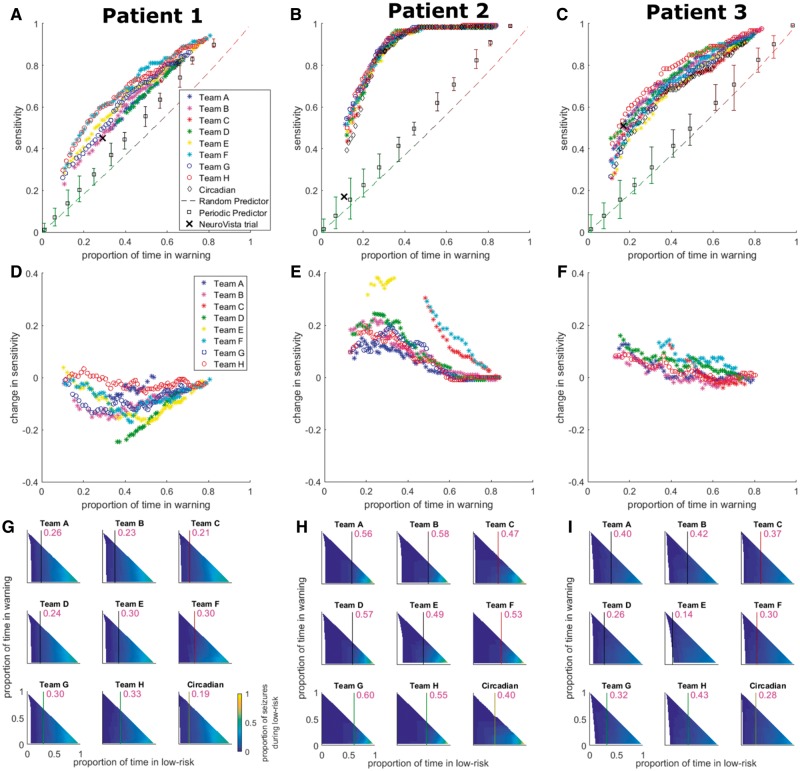
Figure 5.
Pseudo-prospective circadian-weighted seizure prediction results for the held-out data. (A–C) Circadian-weighted seizure prediction performances for Patients 1–3, respectively, for all competition teams considered in the held-out evaluation. The results are compared to circadian, periodic, and random prediction, and to the original NeuroVista trial performance. The y- and x-axes correspond to sensitivity and proportion of time in warning (i.e. time in ‘red-light’ or high-seizure-risk), respectively. For the different teams, data points correspond to different preictal probability thresholds and only data points surviving correction for multiple comparisons are plotted. The legend in A applies to A–C with teams listed in descending rank on the private leaderboard. Error bars for the periodic predictor indicate the ranges of performance over all phases. (D–F) Change in held-out data performance when subtracting sensitivity of the original algorithms from the sensitivity of the circadian-weighted algorithms for Patients 1–3, respectively. The y- and x-axes correspond to change in sensitivity (positive/negative change indicates an increase/decrease in performance when adding circadian-weighting) and proportion of time in warning, respectively. The legend in D applies to D–F. (G–I) Low-seizure-risk advisory performance for Patients 1–3, respectively, for all circadian-weighted algorithms (i.e. teams) considered in the held-out evaluation as well as circadian prediction. The y- and x-axes correspond to proportion of time in warning and proportion of time in low-risk (i.e. time in ‘blue-light’), respectively. The colour bar in G indicates the proportion of seizures occurring during low risk and applies to G–I. The purple vertical lines and numerical values overlaid on the subplots in G–I provide, for a proportion of time in warning of 0.25, the maximum proportion of time in low-risk for which the proportion of seizures occurring in low-risk is at most 0.05.

