. 2018 Jun;20(2):101–111. doi: 10.31887/DCNS.2018.20.2/gcollin

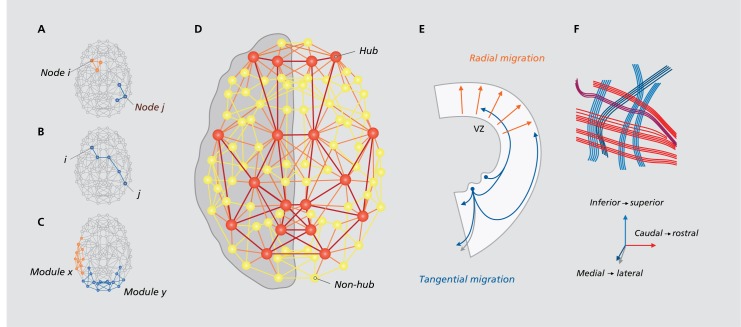
Figure 1. Connectome organization and formation. (A) The neighbors of node i are mutually connected, reflecting local clustering. In contrast, the neighbors of node j are not connected. A network with many triangular motifs (in orange) is highly clustered. (B) The shortest path from node i to node j is four steps. A network's average path length is the average number of steps along the shortest path between each node pair. Lower path length is consistent with a more efficient network. (C) shows connectome modules, with module x reflecting a left lateralized language module, and y posterior visual module. (D) The brain's network contains hubs that are tightly interconnected into a rich club system (in red). (E) illustrates the two main forms of neuronal translocation: radical and tangential migration (VZ = Ventricular Zone). (F) depicts the potentiel grid-like microstructure of the brain's fiber pathways consistent with three primordial gradients of early embryogenesis. (F) reproduced from ref 26. Wedeen VJ, Rosene DL, Wang R, et al. The geometric structure of the brain fiber pathways. Science. 2012;337:1628-1634. Copyright © Amercian Associaion for the Advancement of Science, 2012.

Figure 1