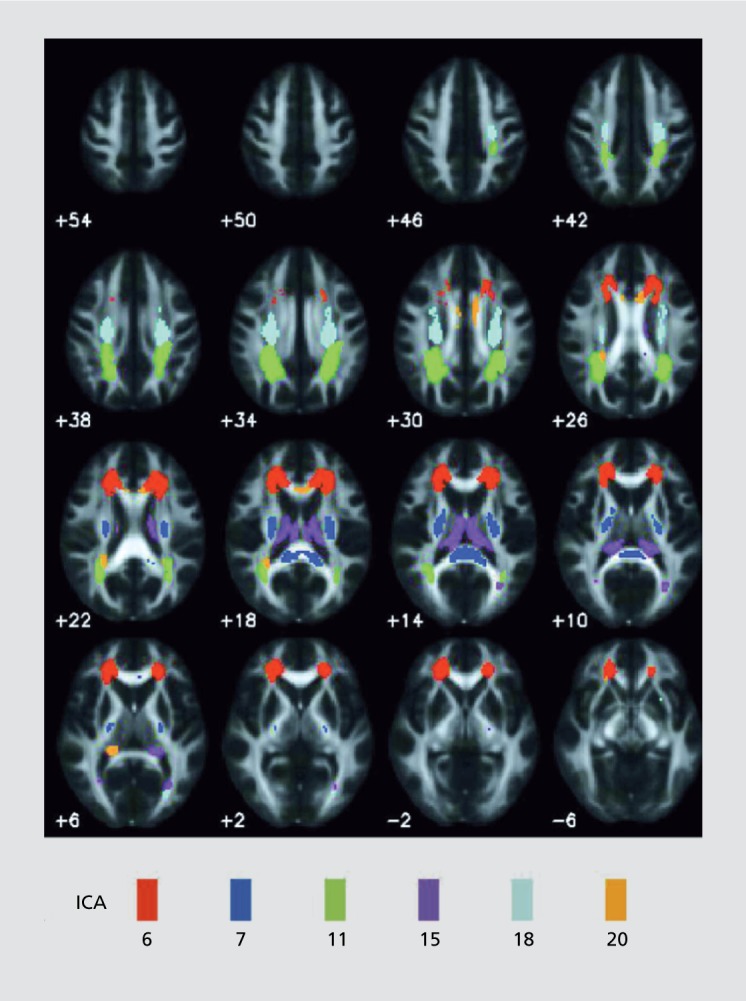
Figure 3. SBM on dMRI data identifies a number of white matter components (highlighted in different colors) all of which show reduced fractional anisotropy in schizophrenia compared with healthy controls. SBM, source-based morphometry; dMRI, diffusion magnetic resonance imaging.

