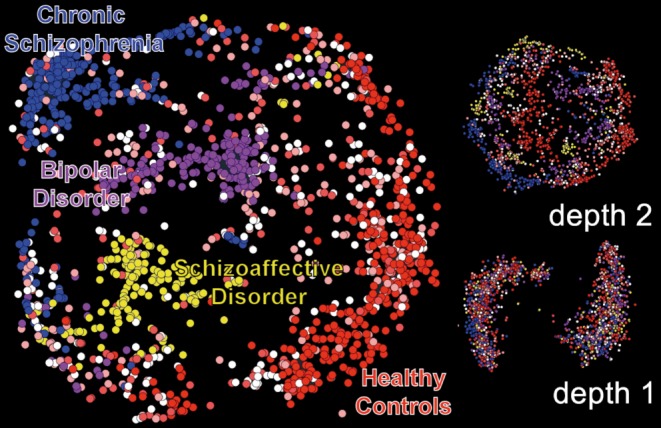
Figure 8. Deep learning results from sMRI data from schizophrenia, schizoaffective, and bipolar patients as well as healthy controls. Each dot represents an individual subject. As the depth of the model increases, the separation between the groups increases, although there are still boundary cases, which may be useful to help refine the diagnostic categories.