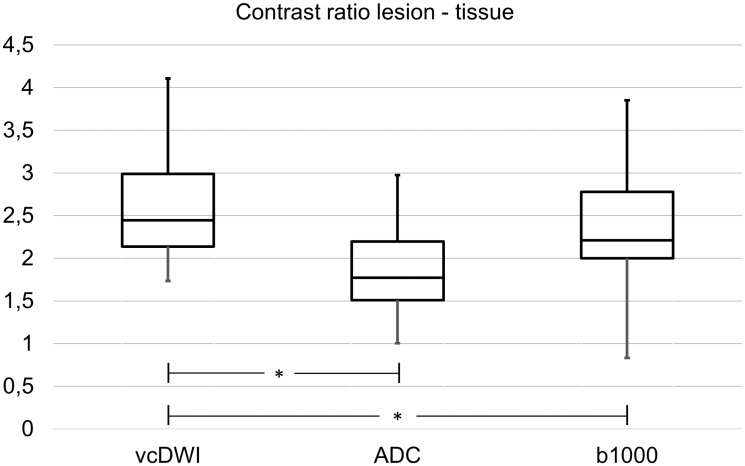
Figure 3.
Box-plot diagram of the contrast ratios (CRs) of ischaemic lesions in voxelwise computed diffusion-weighted imaging (vcDWI), the apparent diffusion coefficient maps (ADC) and the b = 1000 s/mm2 images (b1000) including median, the first and third quartile and minimum and maximum values. The lesion CR in vcDWI was significantly higher (P < 0.05, marked with *) than the lesion CRs in b = 1000 s/mm2 images and in the ADC map.

