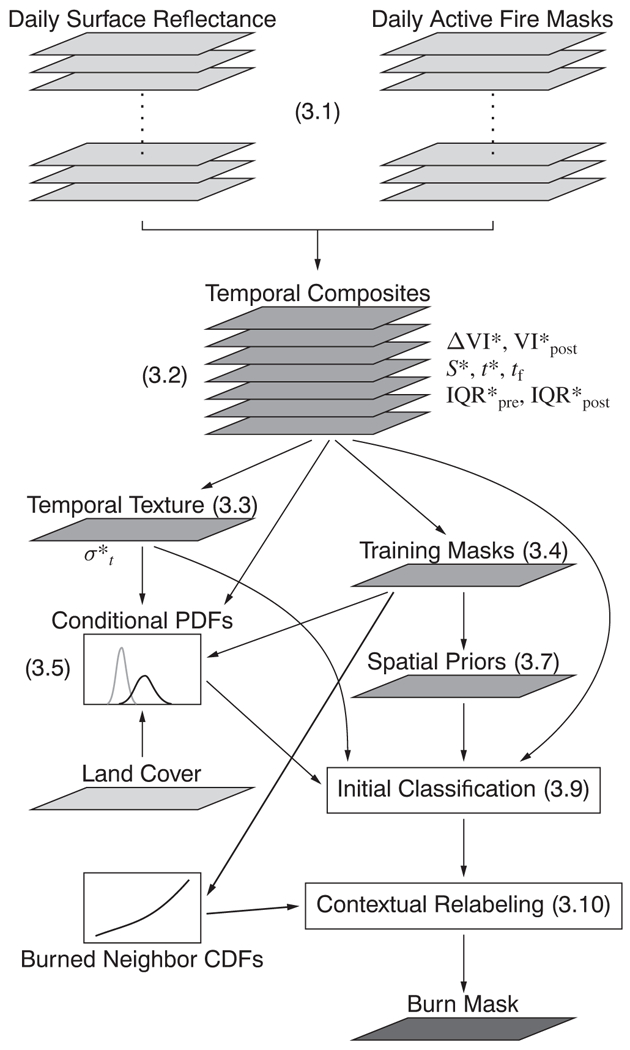
Fig. 1.

Flow chart of Collection 6 MCD64A1 burned area mapping algorithm, which is applied to individual tiles of the MODIS sinusoidal grid. Input data layers are shown in light grey, intermediate data layers computed internally as part of the algorithm are shown in medium grey, and final output map is shown in dark grey. Numbers in parentheses refer to section numbers in the main text.
