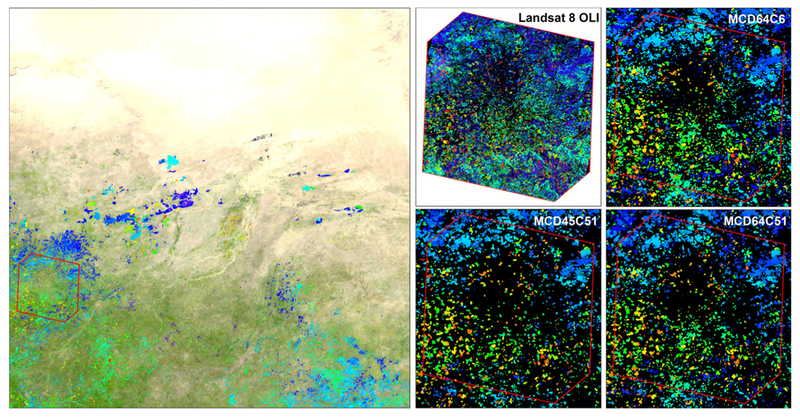
Fig. 10.

MODIS tile h17v07 (Mali) selected for consistency assessment of small burns. Left: burned areas detected by the Collection 6 MCD64A1 product from September 2013 to April 2014, represented with a rainbow scale indicating the day of burning, overlaid on MODIS Blue Marble true-color reflectance to provide geographic context. Right: cumulative map of the burned areas detected through the pair-wise interpretation of nine Landsat-8 OLI ∼ 180 × 180 km images acquired between 28 September 2013 and 8 April 2014, and detail of the Collection 6 MCD64A1 (MCD64C6), Collection 5.1 MCD64A1 (MDC64C51), and Collection 5.1 MCD45A1 (MCD45C51) burned areas shown with the same scale and coverage as the Landsat reference data. (For interpretation of the references to color in this figure legend, the reader is referred to the web version of this article.)
