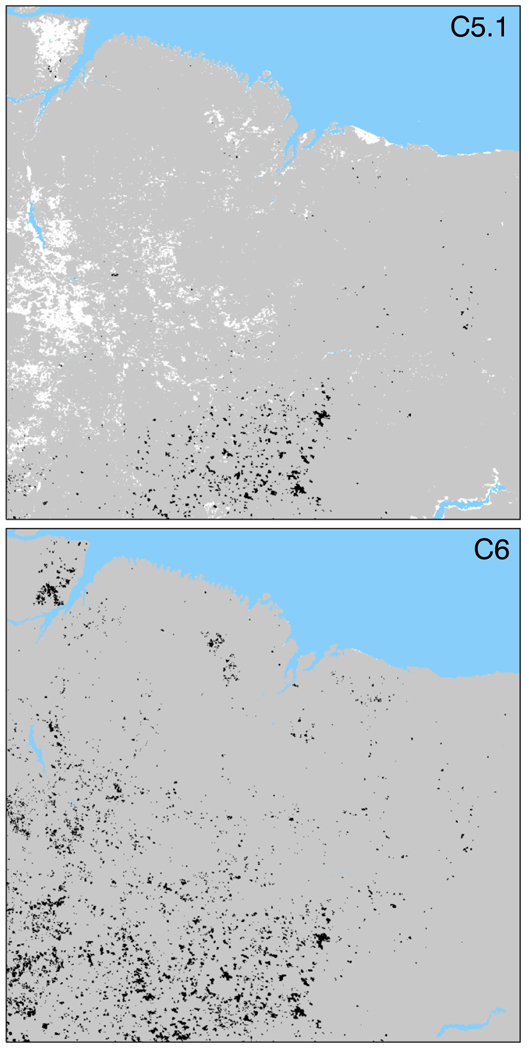
Fig. 5.

Collection 5.1 (top panel) and Collection 6 (bottom panel) MCD64A1 monthly burned area maps for September 2002 in MODIS tile h13v09, which overlaps eastern Brazil, illustrating the improved sensitivity to small burns and the reduction in unmapped grid cells. Unburned land grid cells are depicted in grey, unclassified areas in white, water in blue, and burned grid cells in black. In this formerly problematic case (due to persistent cloud cover), the 1.53 Mha of burned area mapped in the C6 product is four times greater than the 0.38 Mha mapped under C5.1. The tile is approximately 1100 km × 1100 km in size. (For interpretation of the references to color in this figure legend, the reader is referred to the web version of this article.)
