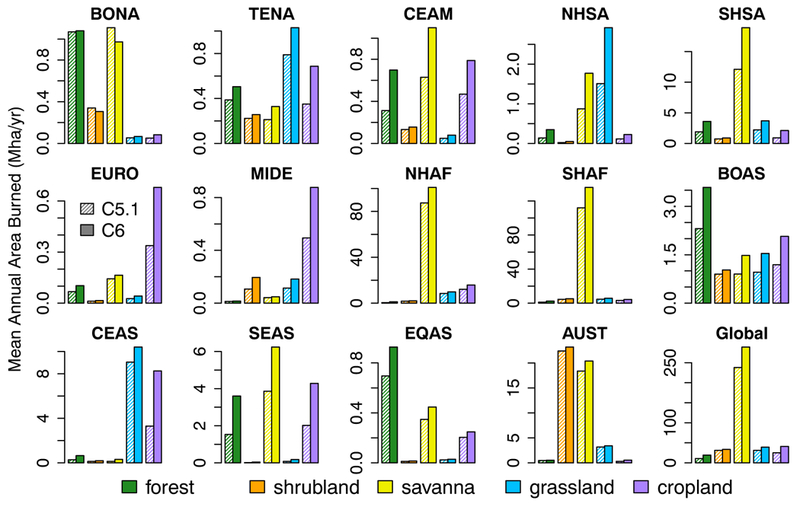
Fig. 6.

Regional 2002–2016 mean an-nual area burned for the C5.1 (hashed bars) and C6 (solid bars) MCD64A1 products, stratified by land cover class. The abbreviations used for the individual region names are listed in Table 3. Mean values take into account land cover changes as reported in the C5.1 MCD12Q1 land cover product for the years 2002–2013 only; for the years 2014–2016 the MCD64A1 burned area was partitioned using the 2013 MCD12Q1 product.
