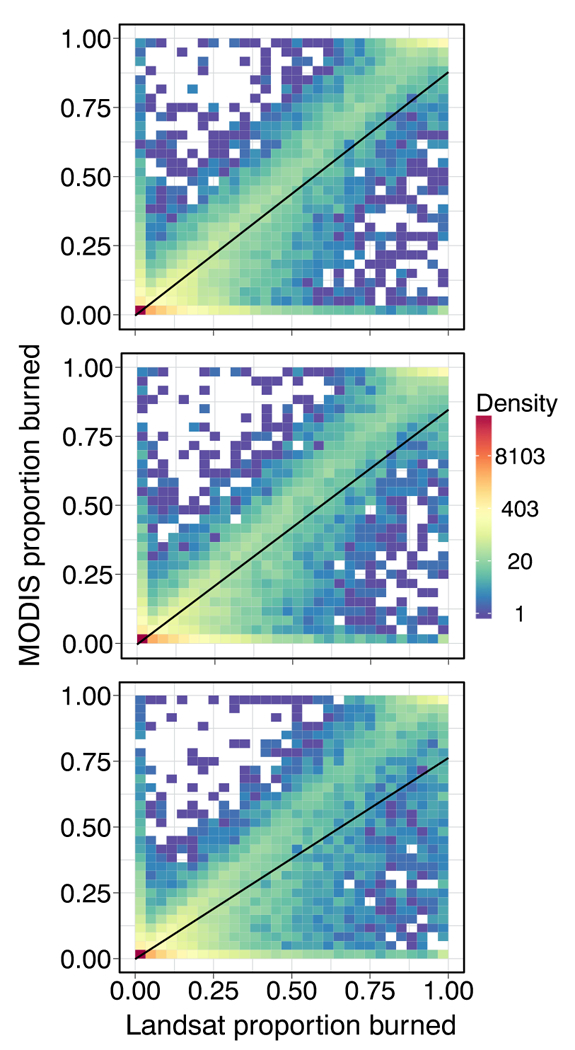
Fig. 9.

Scatter plots of the proportions of 5 km × 5 km cells labeled as burned by the MCD64A1 Collection 6 (top), MCD64A1 Collection 5.1 (middle), and MCD45A1 Collection 5.1 (bottom) products, plotted against the proportion labeled as burned by the reference dataset, considering all the independent reference data derived from 108 Landsat path/rows (Fig. 8). The point densities, calculated using a 50 × 50 quantization of the plot axes, are displayed with a rainbow logarithmic color scale. Regression results are as follows: C6 MCD64A1: 126,888 cells plotted, slope 0.88, intercept −0.003, r2 = 0.818; C5.1 MCD64A1: 113,423 cells, slope 0.85, intercept −0.004, r2 = 0.808; C5.1 MCD45A1: 122,991 cells, slope 0.76, intercept −0.002, r2 = 0.744. (For interpretation of the references to color in this figure legend, the reader is referred to the web version of this article.)
