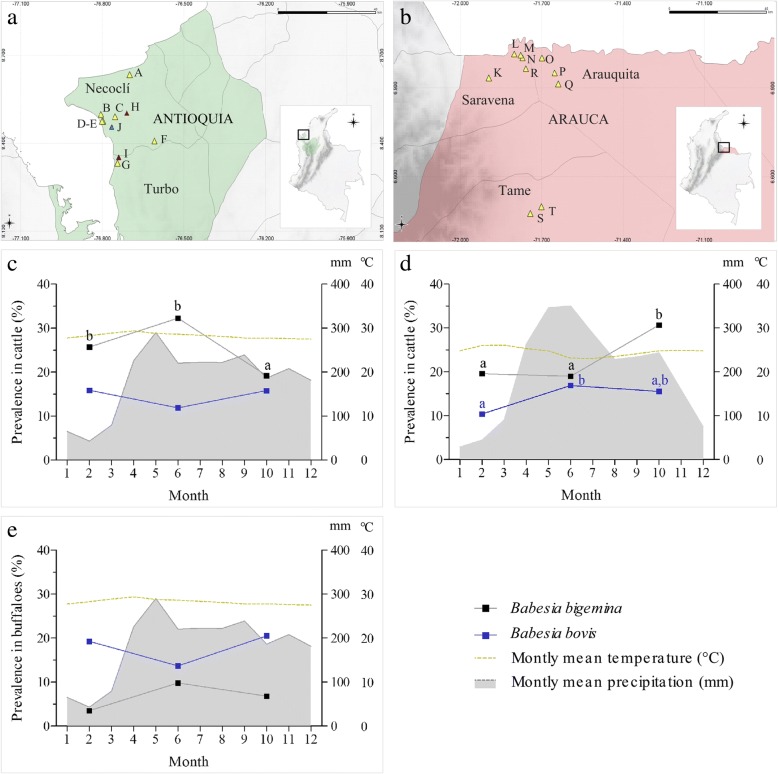
Fig. 1.
Map of Colombia showing the farms in Antioquia (a) and Arauca (b) where sampling was done, and the spatio-temporal prevalence of B. bigemina and B. bovis observed in cattle in Antioquia (c) and Arauca (d), and buffaloes in Antioquia (e). Yellow, blue and red triangles represent the farms where samples of cattle, buffaloes and both species were collected, respectively (see Additional file 1: Table S1 for additional information, according to uppercase farm code letter). Lowercase letters in the graphs represent significant differences assessed by the Chi-square test (P < 0.05)

