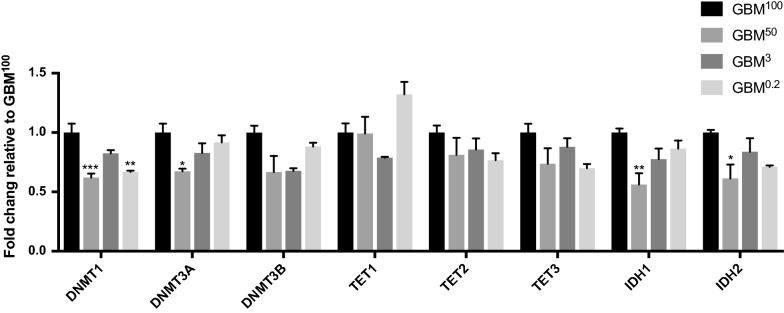
Fig. 4.
Differential expression of the regulators of DNA methylation. Bars represent the mean of the relative quantification levels relative to the GBM100 tumours (relative expression = 1). Error bars show SEM (n = 3 tumours per group; technical replicates per sample). Statistical significance was determined by One-way ANOVA. *, ** and *** p values < 0.05, 0.01 and 0.001, respectively

