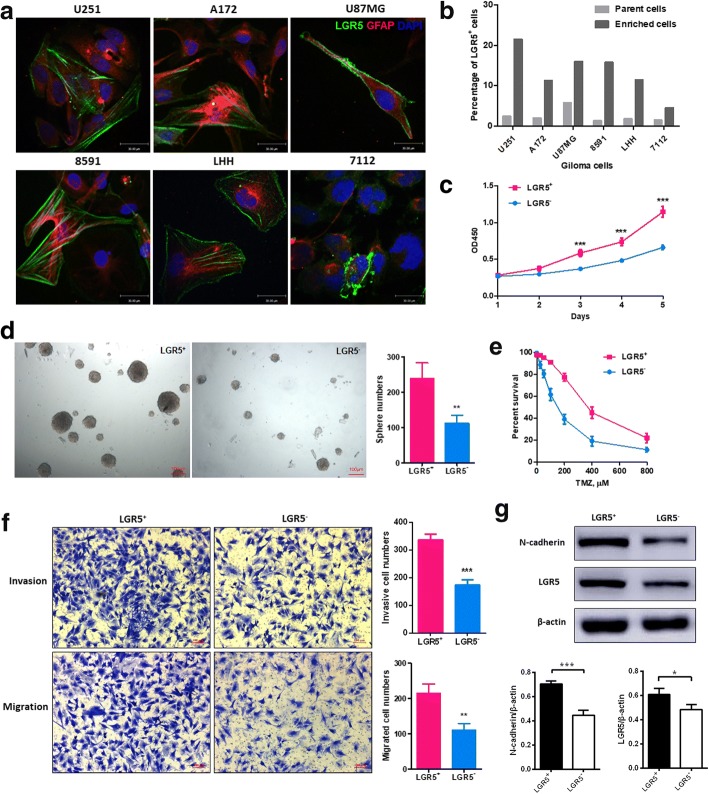
Fig. 1.
LGR5 expression in different glioma cells, and stemness properties of LGR5+ U251 cells in vitro. a The expression and localization of LGR5 and GFAP in the glioma cell lines (U251, A172 and U87MG) and the human primary glioma cells (8591, LHH and 7112). Scale bar = 30 μm. b The enrichment levels of LGR5 expression by FCM in parent cells and enrichment cells. c Cell proliferation assays of LGR5+ U251 cells and LGR5− U251 cells (P < 0.001, n = 3, two-way ANOVA). d Coloning sphere images and sphere numbers in the clone formation assay (P < 0.01, n = 3, Student t test). Scale bar = 100 μm. e Drug resistance curve of TMZ in LGR5+ and LGR5− U251 cells. f Images and numbers of invasive cells in invasion assays (top, P < 0.001, n = 3, Student t test) and images and numbers of migrated cells in migration assays (bottom, P < 0.001, n = 3, Student t test). g Western blot analysis for LGR5 and N-cadherin in LGR5+ and LGR5− U251 cells. The expression levels of LGR5 and N-cadherin were quantified by Image lab software by densitometric analysis and were normalized to the control groups. Human β-actin was used as the internal control. (P < 0.05, n = 3; P < 0.001, n = 3, respectively, Student t test). All data are represented as mean ± SD from triplicate wells. **, P < 0.01; ***, P < 0.001, as compared to control

