Fig. 2.
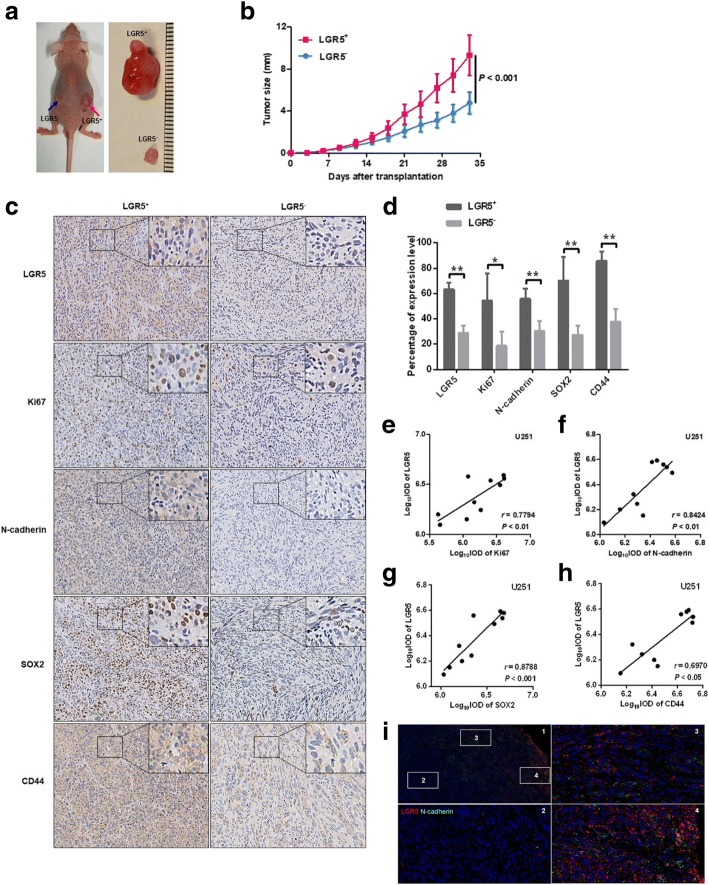
Stemness properties of LGR5+ U251 cells in vivo. a Xenografts produced by LGR5+ and LGR5− U251 cells. b The subcutaneous xenografts growth curve generated by LGR5+ and LGR5− U251 cells in BALB/c-nu mice (two-way ANOVA, P < 0.001). Data are shown as the mean ± SD (LGR5+ U251: n = 5, LGR5− U251: n = 5). c IHC staining of LGR5, Ki67, N-cadherin, CD44 and SOX2 expression in LGR5+ xenografts and LGR5− xenografts (magnification × 200). d The percentage of positive expression of LGR5, Ki67, N-cadherin, CD44 and SOX2 in LGR5+ xenografts and LGR5− xenografts (n = 5, Student t test). Error bars represent the mean ± SD. e The correlation between the levels of LGR5 and Ki67 by Spearman correlation analysis (P < 0.01, r = 0.7794, n = 10). f The correlation between the levels of LGR5 and N-cadherin by Spearman correlation analysis (P < 0.01, r = 0.8424, n = 10). g The correlation between the levels of LGR5 and SOX2 by Spearman correlation analysis (P < 0.001, r = 0.8788, n = 10). h The correlation between the levels of LGR5 and CD44 by Spearman correlation analysis (P < 0.05, r = 0.6970, n = 10). i Double-staining of LGR5 and N-cadherin in U251 subcutaneous xenografts. The xenografts edge (3 and 4) showed many positive cells expressed both LGR5 and N-cadherin, while there was few positive cells in inside xenografts (section “Methods”). Scale bar = 100 μm. *, P < 0.05; **, P < 0.01; ***, P < 0.001

