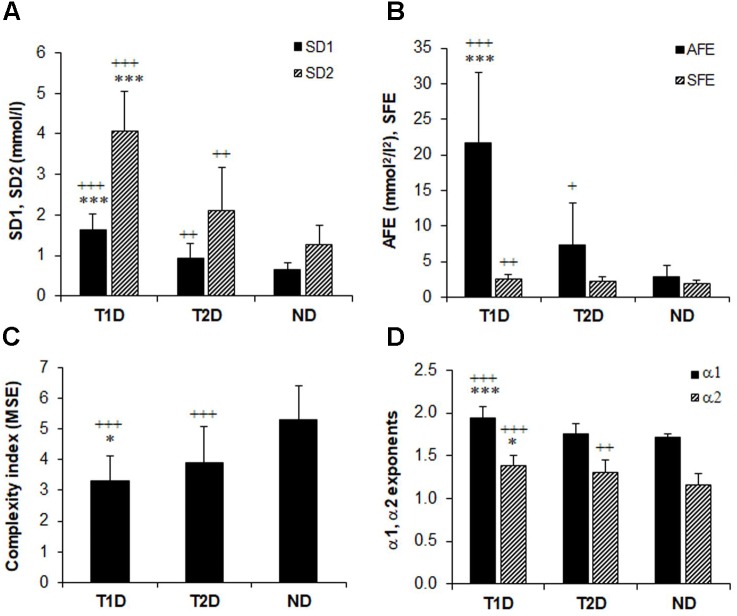
FIGURE 2.
Comparison of glucose variability indices in non-diabetes (ND), type 2 (T2D), and type 1 diabetes (TD1) from the geometric, information, and fractal scaling domains. Analysis of variance (ANOVA) and t-test with Bonferroni–Holm correction gave the between-group differences as indicated: ∗p < 0.05, ∗∗∗p < 0.001 vs. type 2 diabetes and ++p < 0.01, +++p < 0.001 vs. non-diabetes.

