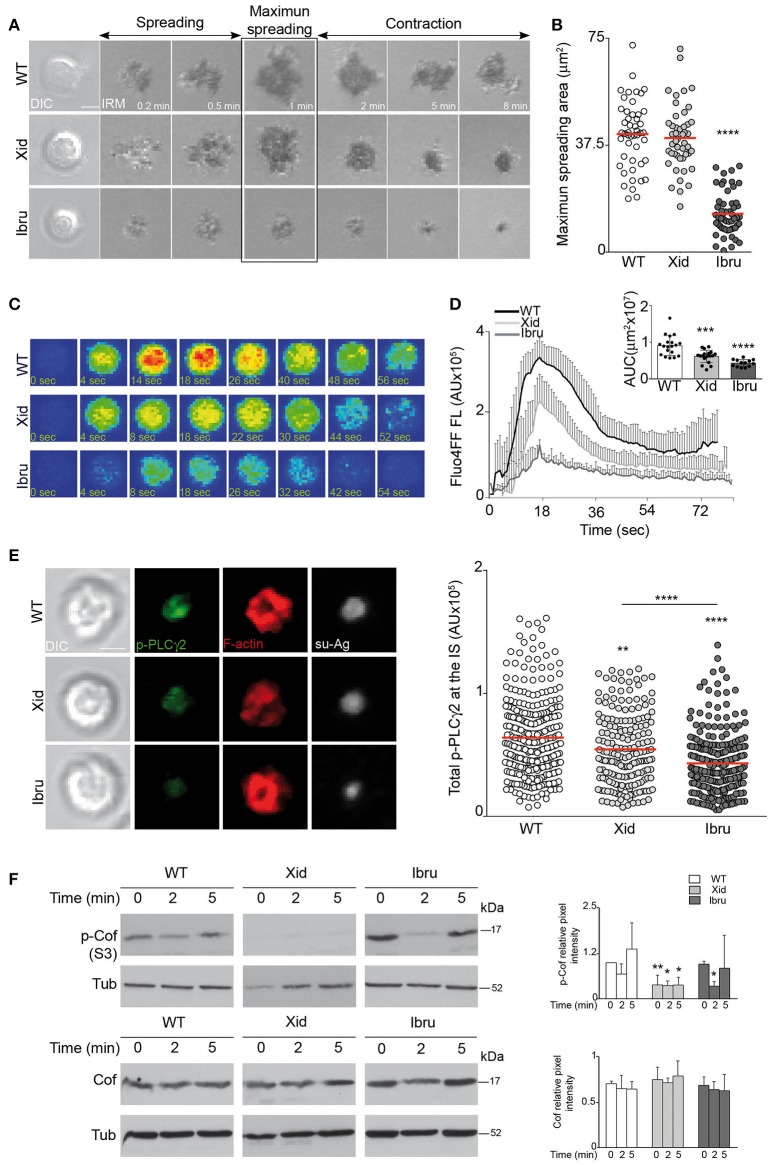
Figure 2.
Antigen gathering is controlled by Btk-kinase activity. (A) DIC and IRM images for representative WT, Xid, and Ibru-B cells over time while forming the IS; antigen, 20 molec/μm2. Spreading and contraction phases are indicated; maximum cell spreading time is highlighted. (B) Maximum spreading area values; each dot represents a single cell. (C) Fluo4FF-labeled WT, Xid and Ibru-B cells as in (A) were monitored for Ca2+ influx. Fluorescence Fluo4FF images of representative B cells over time are shown. (D) Values of total Fluo4FF FL (in AU) over time; data shown as the mean ± SD of 20 B cells/condition. Inner bars-graph, AUC values per B cell and per condition; each dot is a cell. (E) DIC and fluorescence images of phosphorylated PLCγ2 (p-PLCγ2; green), F-actin (red) and antigen (Ag; white) for representative IS-forming B cells, fixed at 10 min; antigen, 20 molec/μm2. Right, values of total p-PLCγ2 FL (in AU) at the IS. (F) Immunoblot of WT, Xid, and Ibru-B cells stimulated with Ab-coated plates, probed with specified antibodies. Right, quantification of phosphorylated-cofilin (p-Cof, S3) and cofilin (Cof) intensity normalized to tubulin (Tub; loading control) by densitometry at each time point. Data for a representative experiment are shown in (B) (n = 4), (D), and (E) (n = 3); data in F are the mean ± SD of three experiments (n = 3). Bar 2 μm. *p < 0.05; **p < 0.01; ***p < 0.001; ****p < 0.0001 by Student's t-test with WT in each case.

