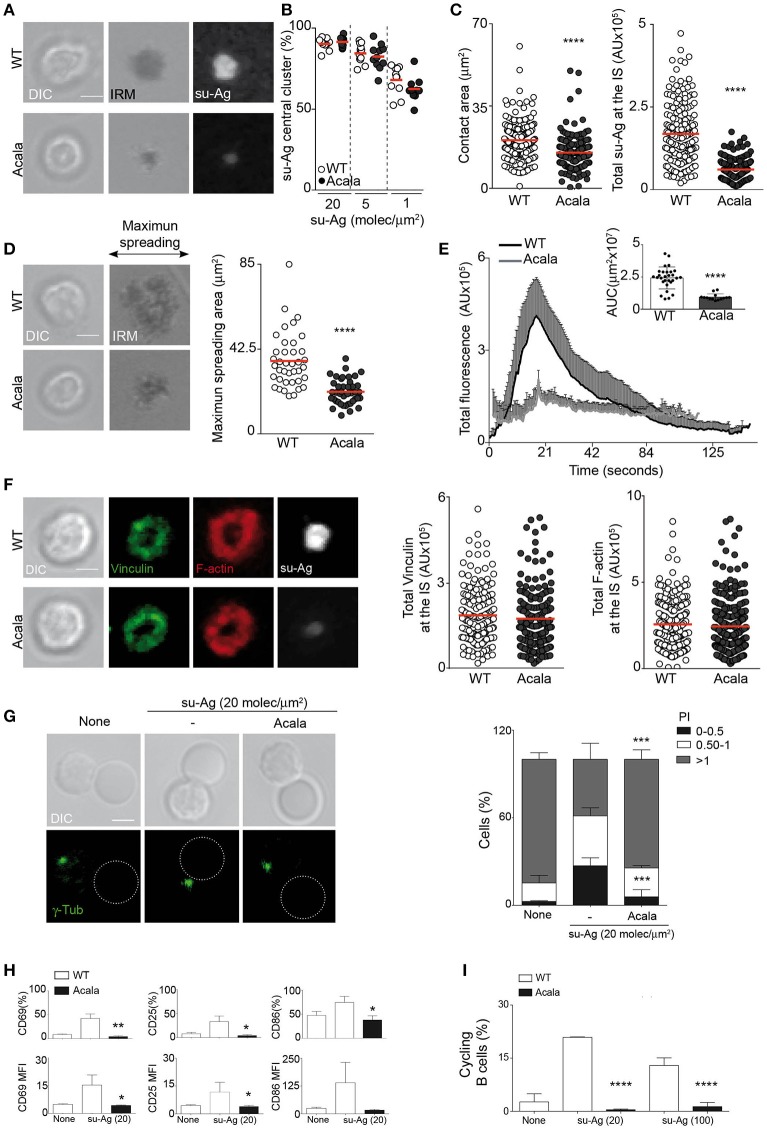
Figure 5.
Acalabrutinib affects su-Ag-triggered IS formation, cell activation and proliferation. (A) DIC, IRM, and fluorescence su-Ag images at the contact plane of representative IS-forming WT B cells, untreated or treated with Acala (500 nM); su-Ag, 20 molec/μm2. (B) su-Ag central cluster formation frequency in presence of distinct su-Ag densities. (C) Values of contact area (estimated by IRM; left) and total su-Ag FL (in AU; right) for IS-forming B cells; su-Ag, 20 molec/μm2. (D) DIC and IRM images of representative untreated or Acala-treated B cells at the time of maximum cell spreading during IS formation. Right, maximum spreading area values (estimated by IRM). (E) Fluo4FF-labeled untreated or Acala-treated B cells were monitored for Ca2+ influx; total Fluo4FF FL values (in AU) over time are shown; data shown as mean ± SD of 20 B cells/condition. Inner bars-graph, AUC values per B cell and per condition; each dot is a cell. (F) DIC and fluorescence images of vinculin (green), F-actin (red), and su-Ag (white) for representative IS-forming B cells, untreated or Acala-treated, fixed at 10 min; su-Ag, 20 molec/μm2. Right, values of total vinculin and F-actin FL (in AU) at the IS. Bar, 2 μm. Each dot in (B) represents a single image field, and in (C–D,F), a single cell. Data from a representative experiment are shown in (B–F) (n = 3). (G) DIC and fluorescence γ-tubulin (γ-tub; green) images are shown of representative untreated or Acala-treated B cell/pseudo-APC conjugates. Dashed circle, pseudo-APC; Bar, 2 μm. Right, frequency of B cells in the specified polarity index (PI) groups. The PI per B cell was estimated as explained in Figure 4C; data shown as mean ± SD of 80 B cells in each case. (H) Untreated or Acala-treated B cells were co-cultured with pseudo-APC, unloaded (none) or su-Ag-loaded (20 molec/μm2; su-Ag-20) at 1:1 ratio, 20 h. Frequencies of B cells expressing CD69, CD25 or CD86 (top) and MFI values for these markers (bottom) in each condition are shown. (I) Violet-labeled untreated and Acala-treated B cells were co-cultured with pseudo-APC, unloaded (none) or su-Ag-loaded (20 molec/μm2, su-Ag-20, ratio 1:5; 100 molec/μm2, su-Ag-100, ratio 1:1), with IL-4, 72 h. Frequencies of cycling B cells in each condition are shown. Data in (B) are the mean ± SD of four experiments (n = 4); data of a representative experiment are shown in (C–F) (n = 3); data in (G) is the merge of two experiments and in (H,I) of three experiments (n = 3). Each dot in (B) represents a single image field, and in (C–D,F), a single cell. *p < 0.05; **p < 0.01; ***p < 0.001; ****p < 0.0001 by Student's t-test with WT in each case.

