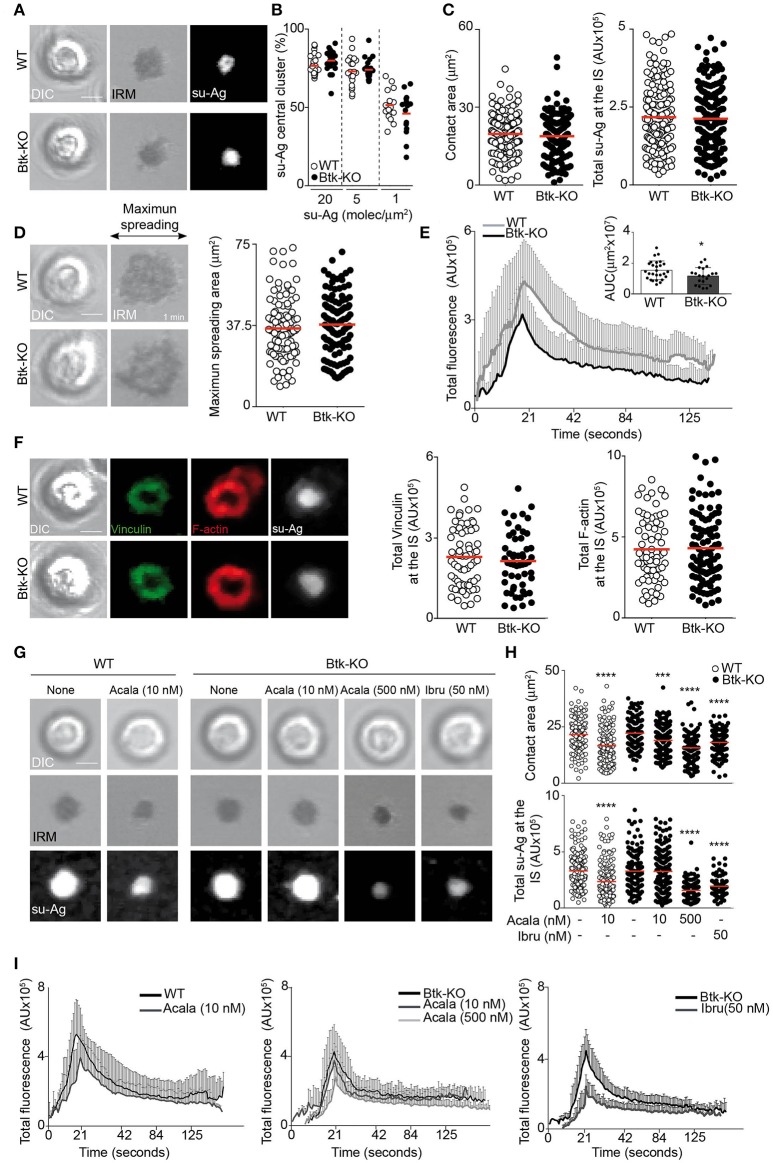
Figure 6.
B cells lacking Btk have no defects in IS formation. (A) DIC, IRM and fluorescence su-Ag images at the contact plane of representative IS-forming WT and Btk-KO B cells; su-Ag, 20 molec/μm2. (B) su-Ag central cluster formation frequency in presence of distinct su-Ag densities. (C) Values of contact area (estimated by IRM; left) and total su-Ag FL (in AU; right) for IS-forming B cells; su-Ag, 20 molec/μm2. (D) DIC and IRM images of representative B cells at the time of maximum cell spreading during IS formation. Right, maximum spreading area values (estimated by IRM). (E) Fluo4FF-labeled B cells were monitored for Ca2+ influx; total Fluo4FF FL values (in AU) over time are shown; data shown as mean ± SD of 20 B cells/condition. Inner bars-graph, AUC values per B cell and per condition; each dot is a cell. (F) DIC and fluorescence images of vinculin (green), F-actin (red) and su-Ag (white) for representative IS-forming B cells fixed at 10 min; su-Ag, 20 molec/μm2. Right, values of total vinculin and F-actin FL at the IS. (G) DIC, IRM and fluorescence su-Ag images at the contact plane of representative IS-forming WT and Btk-KO B cells, untreated or treated with the indicated inhibitors at the specified dose; su-Ag, 20 molec/μm2. (H) Values of contact area and total su-Ag FL for IS-forming B cells in each condition. (I) Total Fluo4FF FL values (in AU) over time are shown for WT (left panel) and Btk-KO (mid- and right panels) B cells in each specified condition; data shown as mean ± SD of 20 B cells/condition. Bar, 2 μm. Each dot in (B) represents a single image field, and in (C–D,F) and (H), a single cell. Data from a representative experiment are shown in (B–G) (n = 3); data from representative experiments are shown in I (n = 2). *p < 0.05; ***p < 0.001; ****p < 0.0001 by Student's t-test with WT or Btk-KO in each case.

