. 2018 Jul 23;41(3):624–637. doi: 10.1590/1678-4685-GMB-2017-0229

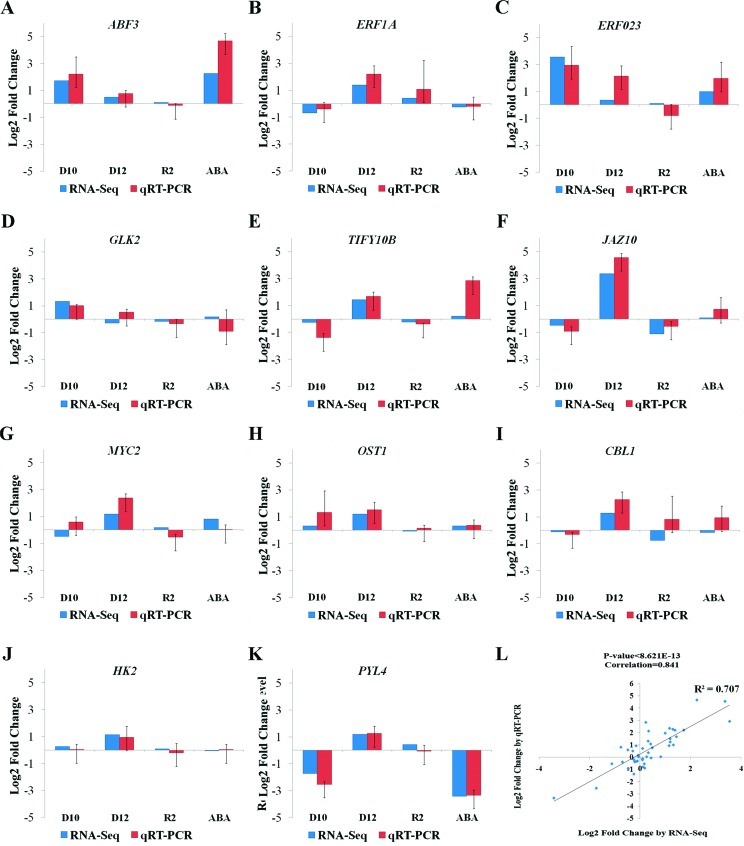
Figure 3. Quantitative RT-PCR validations of differentially expressed genes in four situations. (A) to (K) are the genes ABF3 (AT4G34000), GLK2 (AT5G44190), ERF023 (AT1G01250), ERF1A (AT3G23240), MYC2 (AT1G32640), HK2 (AT5G35750), CBL1 (AT4G17615), OST1 (AT4G33950), PYL4 (AT2G38310), JAZ10 (AT5G13220) and TIFY10B (AT1G74950), respectively. The data are presented as the log2 value of the fold change from RT-qPCR and RNA-Seq. D10, D12, R2 and ABA represent plants under drought stress for 10 days, 12 days, rewatered for 2 days, and sprayed with 10 (μmol/L ABA for 4 hours, respectively. Error bars represent the mean ± SD of three biological replicates. (L) Pearson correlation analysis between the results of the two methods was performed, and a scatter plot was generated.

Figure 3