. 2018 Jun 28;41(3):692–698. doi: 10.1590/1678-4685-GMB-2017-0192

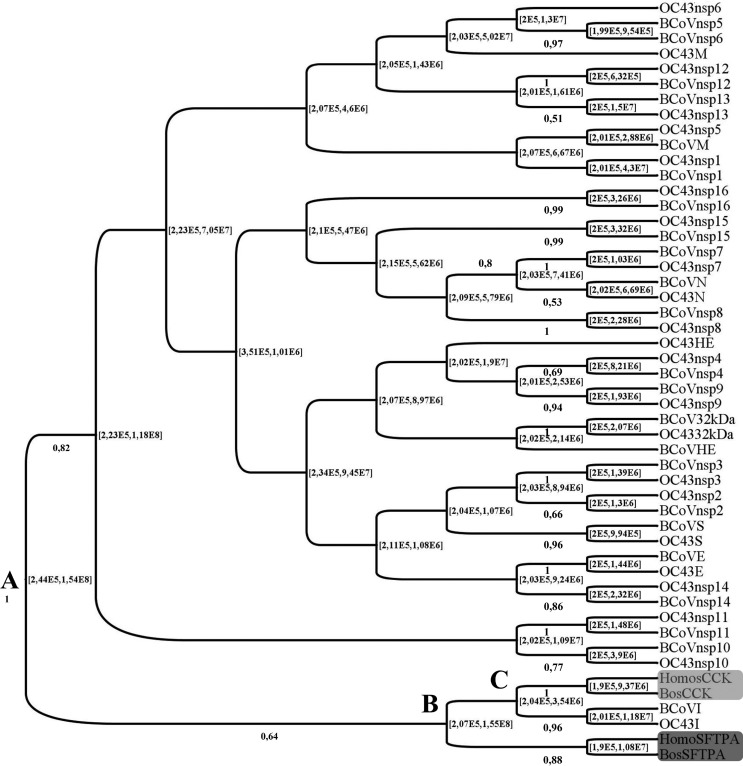
Figure 3. MCC tree (burn in = 10% states, uncorrelated exponential clock and constant population size) for BCoV and HCoV-OC43 coding regions/mRNAs for nsps1-16, ns2 and structural proteins HE, S, E, M, I and N and the representatives (mRNAs) of human and bovine highly-expressed, tissue specific proteins CCK (light grey rectangle, cholecystokinin, enteric tract) and SFTPA1 (dark grey rectangle, surfactant protein A1, respiratory tract) based on the respective binary RSCU (Relative synonymous codon usage) values, showing the host/viruses split nodes A, B and C. Values to the left of each node are the posterior probabilities (only values > 50 are shown) and values to the right of each node are the 95% HPD (in years since 2004, the date of the HCoV-OC43 strain 19572 detection).

Figure 3