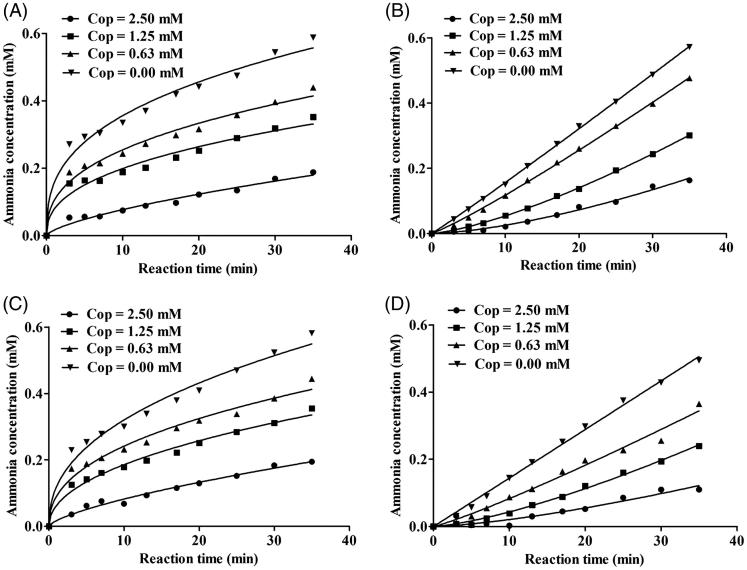
Figure 4.
Reaction progress curves of urease-catalysed hydrolysis of urea in the presence or absence of coptisine (Cop). Reaction progress curves in the non-pre-incubated (A: HPU; B: JBU) and pre-incubated systems (C: HPU; D: JBU). Curves were obtained by measuring concentration of ammonia versus incubation time. The concentrations of Cop were 0, 0.63, 1.25, and 2.50 mM.

