
Figure 3. Both ORF1p and ORF2p contribute to the observed low retrotransposition rate of L1PA13A.
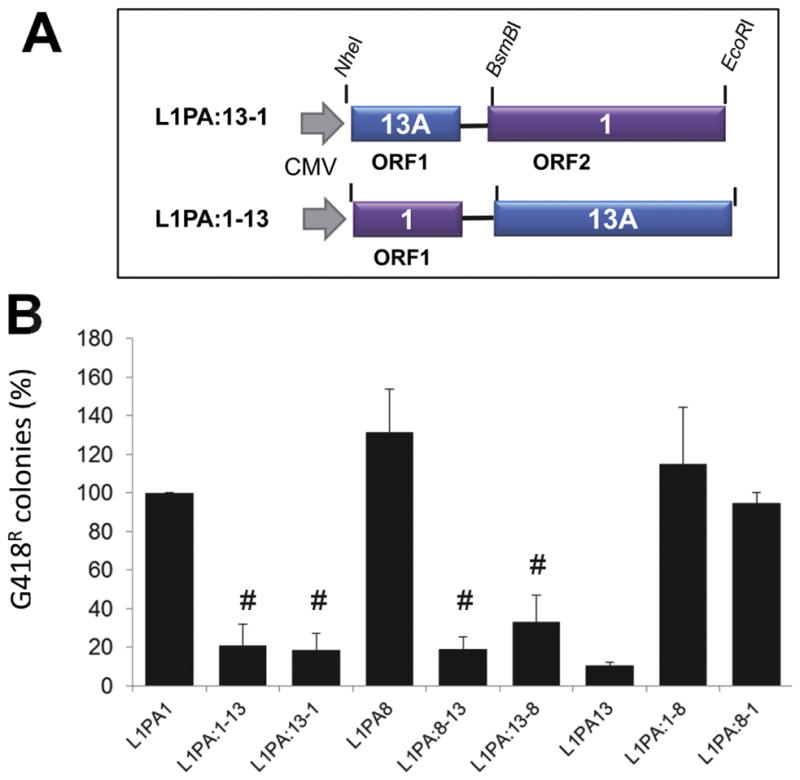
A. Representative schematic of the chimeric L1s with the unique restriction sites used in the building of the constructs is shown. B. The relative retrotransposition efficiencies of the tagged chimeric L1 elements in HeLa cells are shown. Columns represent the G418R colony means normalized relative to the L1PA1 (100%) with the standard deviation shown as error bars. # indicates results that are NOT significantly different from L1PA13 Student’s paired t-test (P>0.1; n ≥ 4).