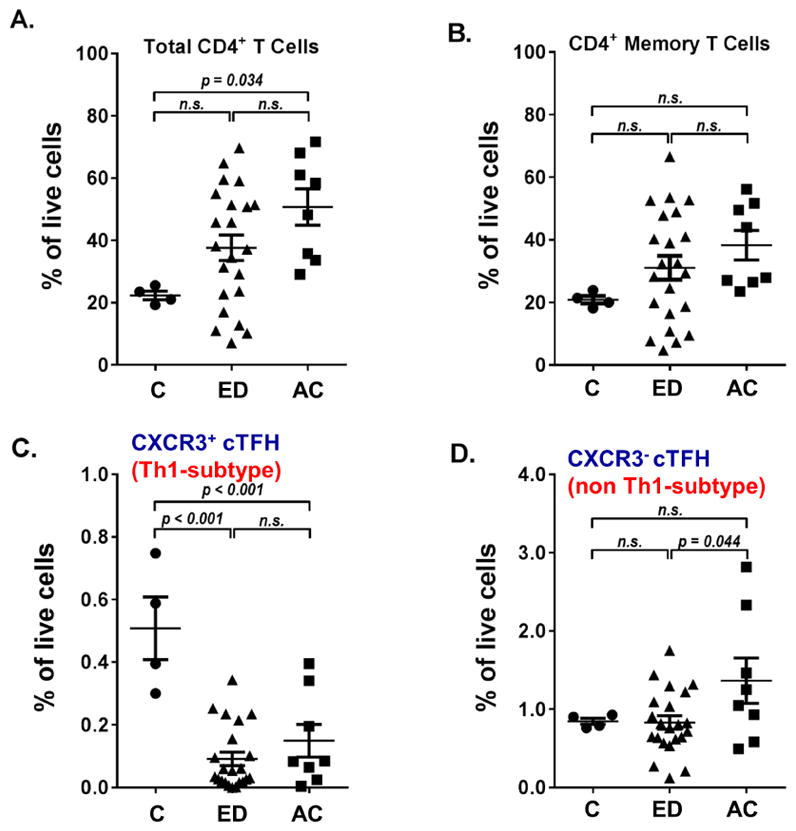
Fig. 1. Levels of total CD4+T cells, CD4+ memory T cells, CXCR3+ and CXCR3−cTFH cells in the study cohorts in relative to frequency of live cells.

Th cell proportions in Control, ED and AC patients. Whole PBMCs from patients were stained for viability and assessed via flow cytometry. Percentages shown are of live cells. Normal control N =4, ED N = 21, AC N =8. (A) Percentage of CD3+ CD4+ T cells in total live cells. (B) Percentage of CD3+ CD4+ CD45RA− memory T cells in total live cells. (C) Percentage of CD3+ CD4+ CD45RA− CXCR5+ CXCR3+ PD-1+cTFH cells in total live cells. (D) Percentage of CD3+ CD4+ CD45RA− CXCR5+ CXCR3− PD-1+cTFH cells in total live cells. P-values shown via analysis of variance (ANOVA) with Tukey post-hoc analysis. Abbreviation: N.S., not significant.
