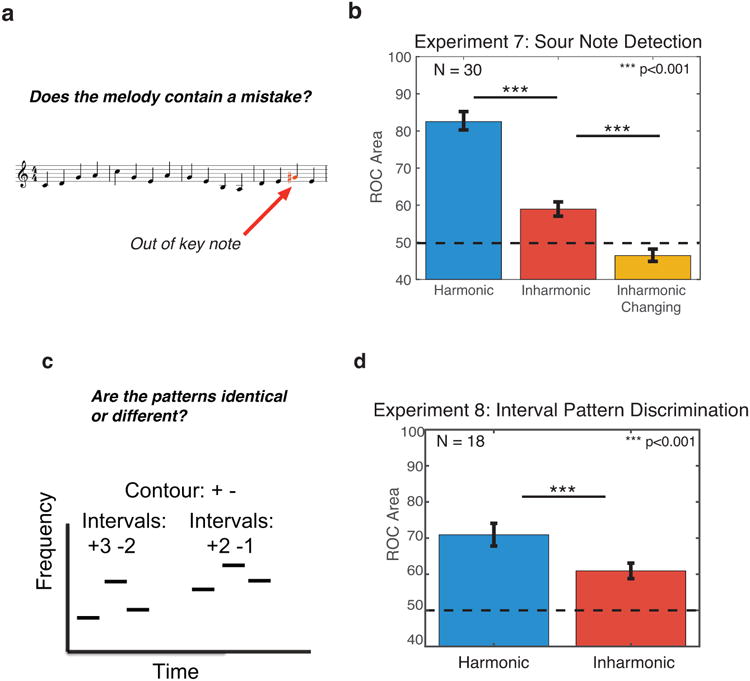
Figure 6. Task and results for Experiments 7 and 8 – sour note detection and interval pattern discrimination.

(A) Sample trial from Experiment 7. Participants judged whether a melody contained a ‘sour’ (out of key) note.
(B) Results for Experiment 7. Performance was measured as the area under Receiver Operating Characteristic (ROC) curves. Error bars denote standard error of the mean.
(C) Schematic of a sample trial from Experiment 8. Participants judged whether two melodies were the same or different. On ‘different’ trials (pictured) the two melodies had different intervals between notes, but retained the same contour. The second melody was always transposed up in pitch relative to the first.
(D) Results for Experiment 8. Performance was measured as the area under Receiver Operating Characteristic (ROC) curves. Error bars denote standard error of the mean.
