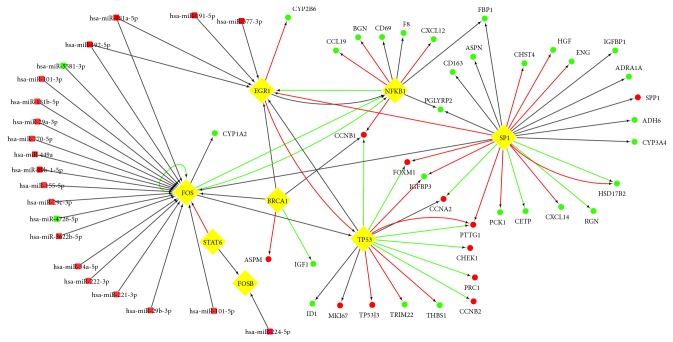
Figure 5.
miRNA-TF-mRNA regulatory network for HCC. The squares in the network represented miRNAs, and the ellipses represented mRNAs, and the diamonds represented TFs. The nodes in red were upregulated, whereas the nodes in green were downregulated. The interaction relationship among TFs, mRNAs, and miRNAs was represented by arrows, and the direction of the arrow was from the source to the target. Different colors in the lines represented the different interaction relationship among TFs, mRNAs, and miRNAs: red was for activation, green for repression, and grey for unknown.

