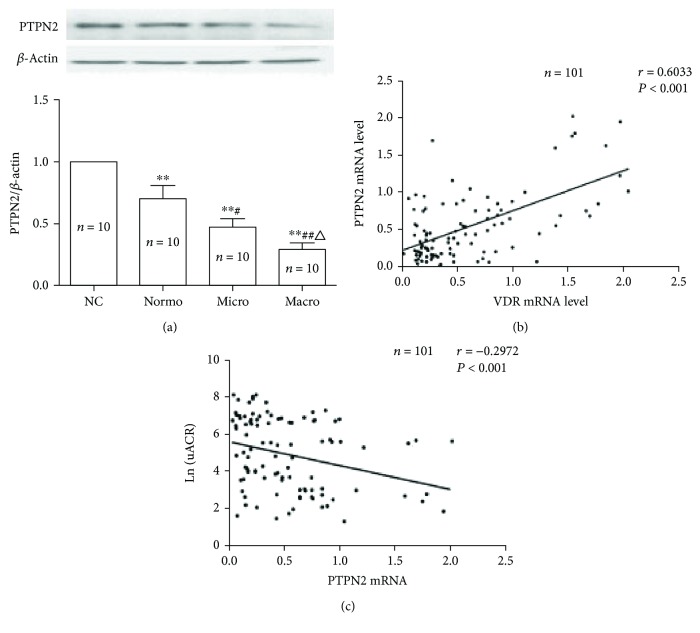
Figure 2.
PTPN2 expression in PBMCs is downregulated in T2DM and positively correlated with VDR. (a) PTPN2 protein levels determined by Western blot (n = 10 in each group, age- and gender-matched); β-actin was used as loading controls. (b) PTPN2 mRNA levels in NC (n = 30), normo (n = 29), micro (n = 34), and macro (n = 38) groups were quantified by real-time RT-qPCR. Scatterplot showing a positive relationship between PTPN2 mRNA levels and VDR mRNA level (n = 101; r = 0.6033; P < 0.001). (c) Scatterplot showing inverse relationship between PTPN2 mRNA levels and uACR level (n = 101; r = −0.2972; P < 0.001). Data represents mean ± SD versus NC (∗∗P < 0.01), versus normo (#P < 0.05, ##P < 0.01), and versus micro (△P < 0.05).

