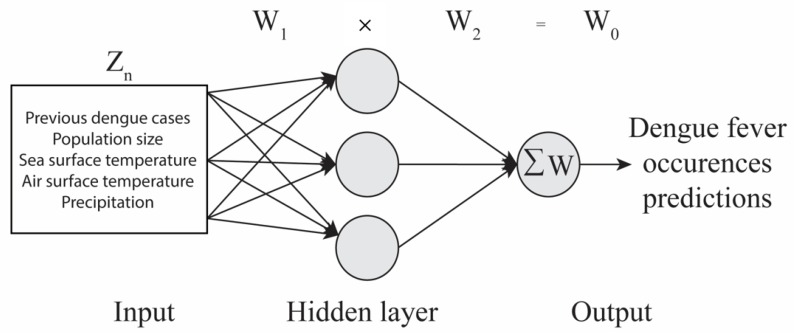
Figure 2.
Artificial neural networks (ANNs) schematic. Example of an ANN schematic showing the input layer, hidden layer, and output layer. ANNs calculate weights from variables (Zn) in the input to hidden layer (W1). The hidden layer then combines these weights and calculates a new set of weights (W2). The neural pathway strengths (W0) are then calculated, with the equation above the schematic (W1 × W2 = W0), to obtain the strength of influence to predict outcomes, following Duncan et al. [51] and Duncan [56].

