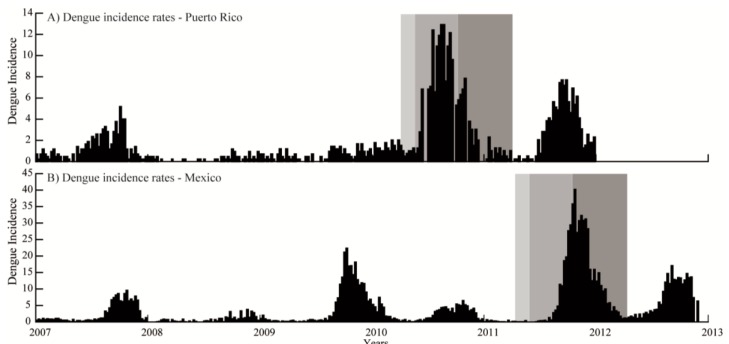
Figure 3.
Dengue fever incidence rates distributions for San Juan, Puerto Rico and the northwest region of Yucatan, Mexico. Dengue incidence rates per 100,000 inhabitants from 2007 to 2012 for (A) San Juan, Puerto Rico; and (B) northwest coast of Yucatan, Mexico. Data only includes these years to show patterns and epidemic years, which for both locations were 2007 and 2011. The three shaded gray boxes represent the pre-epidemic (weeks 10–20), epidemic (weeks 21–40), and post-epidemic (weeks 41–49) periods.

