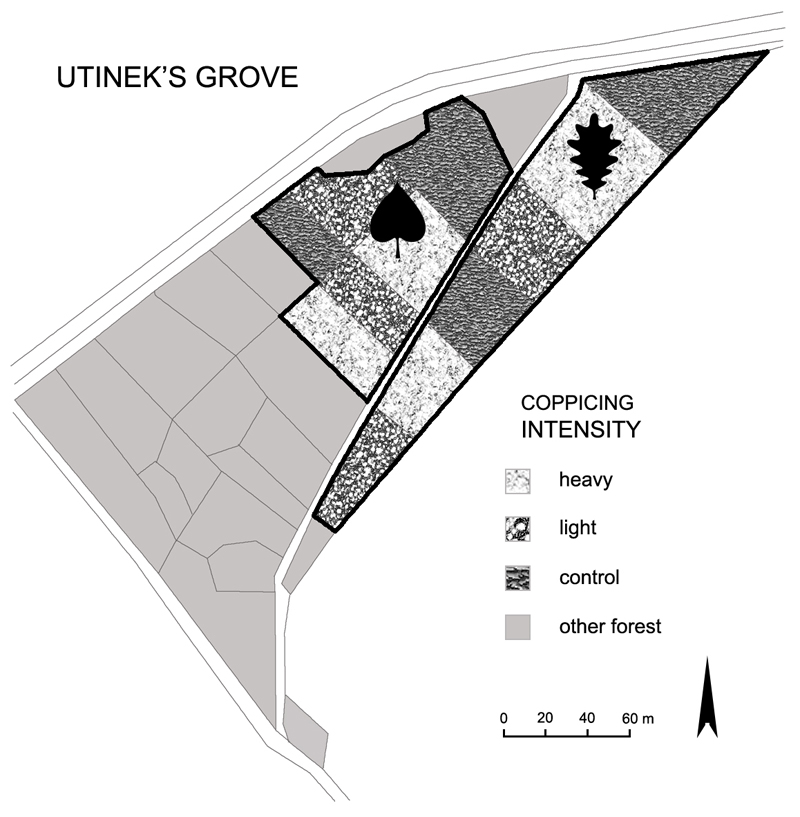
Fig. 1.
Schematic map of the Utinek’s Grove with the coppice introduction experiment. Compartments with different tree canopy thinning intensities (visualized by filling pattern) in parts dominated by oak and lime (leaf symbols) are depicted. Each compartment contains a 30m-long transect with four annually sampled plots.

