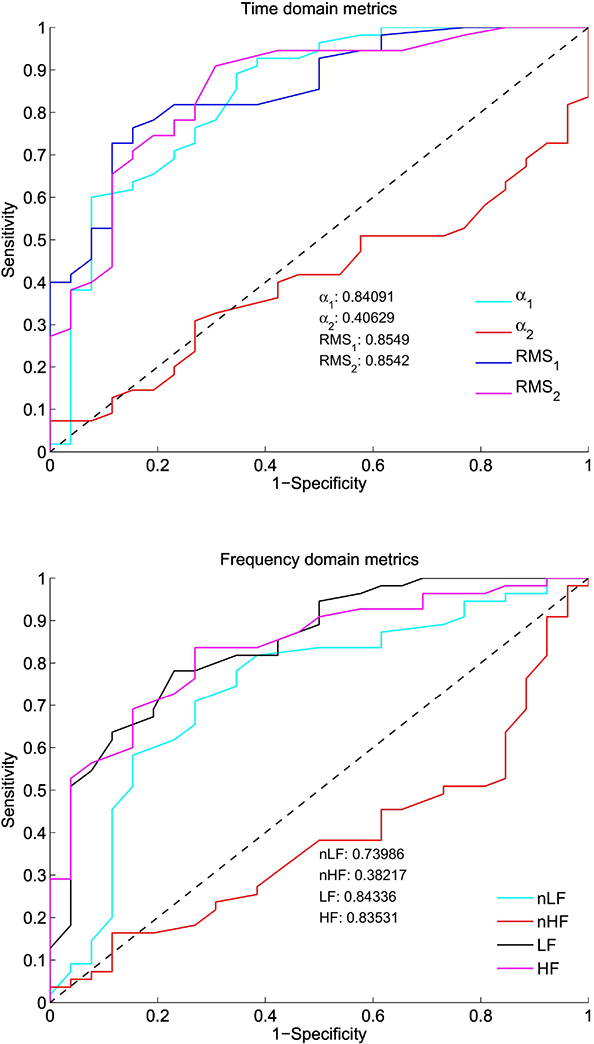
Figure 1: Time and Frequency Domain Receiver Operating Characteristic Curves (ROC).

The ROC area under the curve was calculated for (A) time domain indices (α1, α2, RMS1 [sec], and RMS2 [sec]) and for (B) frequency domain indices (nLF, nHF, LF [dB], and HF [dB]). The curves show higher ANS tone in term control versus preterm infants at term-equivalent age in α1, RMS1, RMS2, nLF, LF, and HF. The diagonal dashed line indicates an area under the curve of 0.5.
