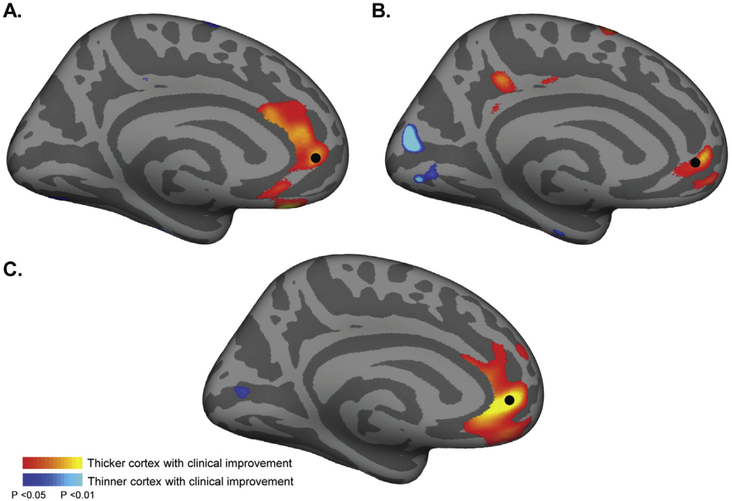
Fig. 2. Cross-cohort thickness data contributing to main finding.
Panels A and B show the results of the main analysis (Fig. 1) from the Cornell (A) and BIDMC (B) cohorts, respectively with the combined findings in C. For reference a black dot denotes the rACC region where the effect was strongest in the group analysis. Scatter plots showing the correlation of clinical response and cortical thickness from each site are displayed in Fig. S4. Note a lower statistical threshold was used here (P < 0.05) relative to the main analysis to account for the reduced power from a smaller sample size.

