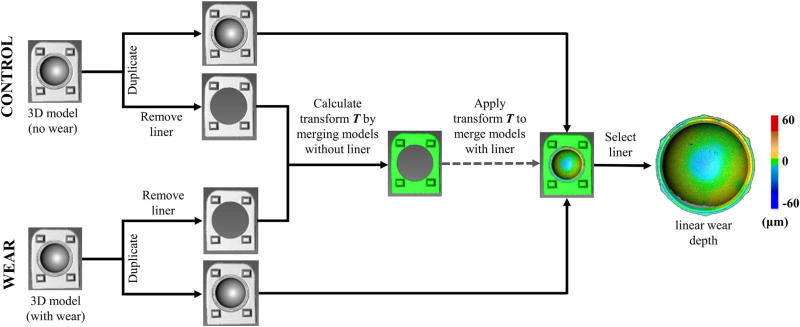
Fig. 4.
Flow chart of the post-processing methodology to measure wear depth. Three-dimensional models of control and wear specimens were merged, and the deviation between merged specimens was defined as wear depth. To improve alignment, the transformation matrix used to merge the 3D models was calculated when the liner was removed.

