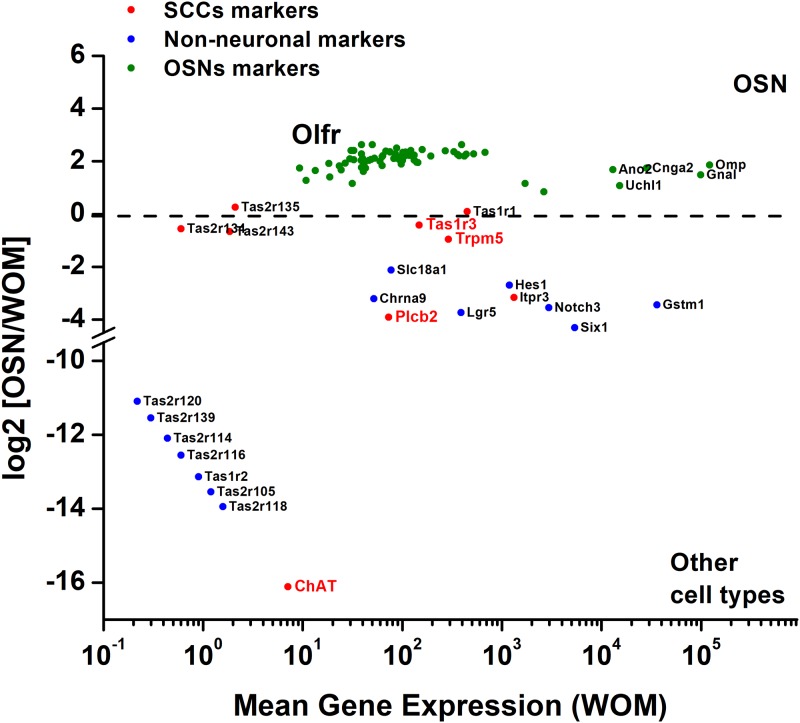
Fig 2. Differential gene expression analysis of mouse OSNs and whole olfactory mucosa (WOM).
Fold-change was calculated as [OSNs]/[WOM], which gives positive results for those genes mainly expressed in the OSNs (green; Olfr, all olfactory receptors), while negative values can be associated to genes more abundant in non-neuronal cell types of the epithelium (blue and red). Underlined genes in red are the typically expressed by SCCs whose expression in MVCs was analyzed in this study.

