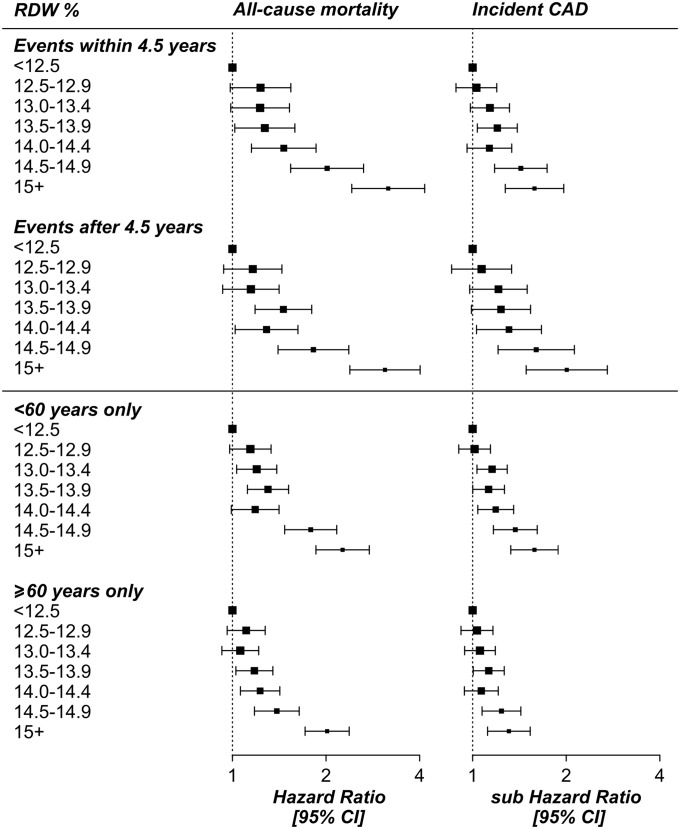
Fig 2. RDW analysis of incident events stratified by follow-up time and age.
RDW = red blood cell distribution width; CAD = coronary artery disease (myocardial infarction or angina); CI = Confidence Interval. Hazard Ratios (the mortality analysis) are from Cox Proportional Hazards models; sub Hazard Ratios (for incident disease) are from Competing Risks Regression models. Analyses excluded participants with prevalent diseases at baseline assessment (anemia, CAD, cancer, diabetes, stroke, COPD or hypertension), and were adjusted for age, sex, smoking status, education level, hemoglobin concentration, and mean corpuscular volume. See Table A in S1 File for full results.

