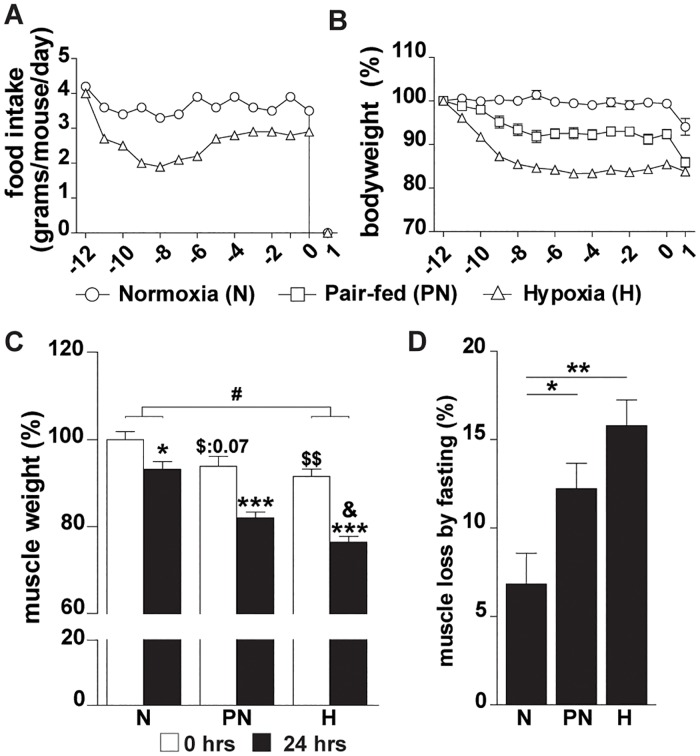
Fig 1. Hypoxia sensitizes skeletal muscle to fasting-induced atrophy.
(A): Food intake in gram/mouse/day per experimental condition. (B): Bodyweights. (C): Muscle weights of gastrocnemius muscle normalized to tibia length, were expressed relative to normoxic mice (day 0). (D): Loss of muscle mass per condition after 24 hrs of fasting (expressed relative to mass before fasting; day 0). Significant differences are indicated by (*): comparing 0 hrs fasted and 24 hrs fasted for each condition, * = P< 0.05, ** = P≤ 0.01 or *** = P≤ 0.001. Trends (0.05 ≤ P ≤ 0.1) are indicated by the specific P-value. ($): comparing PN- and H-group to N-group at 0 hrs fasted, (&): comparing PN- and H-group after 24 hrs fasting, (#): comparing the differences in response to fasting between PN- and H-group. (n = 6–8).

