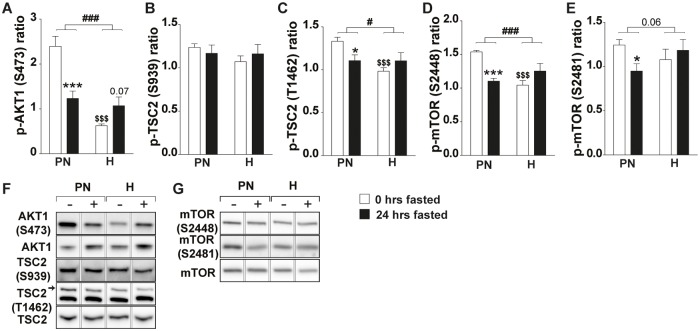
Fig 4. Fasting-induced attenuation of AKT1/TSC2 and AKT1/mTORC1 signaling does not correlate with mTORC1 activity under hypoxic conditions.
(A) Ratio of p-AKT1 (S473) over total AKT1. (B) Ratio of p-TSC2 (S939) over total TSC2. (C) Ratio of p-TSC2 (T1462) over total TSC2. (D) Ratio of p-mTOR (S2448) over total mTOR. (E) Ratio of p-mTOR (S2481) over total mTOR. Representative images of Western blots (reordered to match figures). Data are normalized to the basal expression of the normoxic group at day 0. Significant differences are indicated by (*): comparing 0 hrs fasted and 24 hrs fasted for each condition, * = P< 0.05, ** = P≤ 0.01 or *** = P≤ 0.001. Trends (0.05 ≤ P ≤ 0.1) are indicated by the specific P-value. ($): comparing PN- and H-group to N-group at 0 hrs fasted, (#): comparing the differences in response to fasting between PN- and H-group. (n = 6–8).

